
Figure 1. Overview of RNA‐seq circuit characterization.
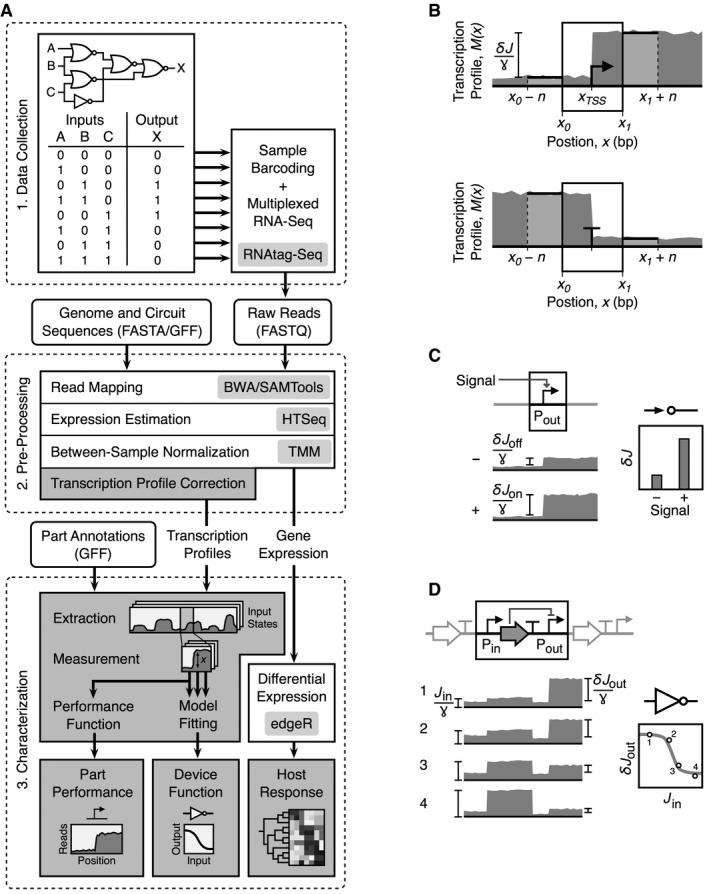
- Circuit characterization pipeline. Square boxes are the major steps in the process, and rounded boxes are input/output files. Light gray boxes denote experimental protocols or computational tools used during that process. Dark gray boxes correspond to the algorithms developed in this work and the major outputs from the pipeline. Details regarding the software to process sequencing data are provided in the Materials and Methods.
- Characterization of sensors. The activity of the output promoter is measured in the absence and presence of the associated signal.
- Characterization of gates. Measurements of the total input RNAP flux and the change due to the promoter are measured for each state, and these data are used to parameterize the response function. Parameters correspond to equation 4.