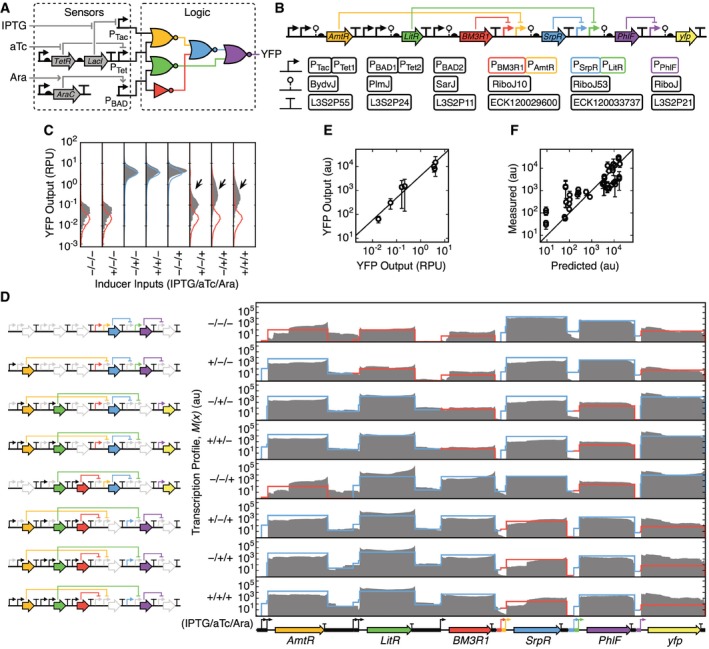
Figure 2. Characterization of a genetic circuit.

- The sensors and wiring diagram for the three‐input combinatorial logic circuit are shown. Colors correspond to the repressors used for each gate.
- Genetic implementation of the logic circuit with annotated part names. Genetic parts are shown using SBOLv notation.
- Flow cytometry data of the YFP output for all inducer input combinations (filled gray distributions) and the predicted distributions from Cello (blue are on; red are off). Arrows highlight cells responding improperly.
- Transcription profiles for the circuit are shown for all combinations of inducers (0.5 mM IPTG/22 nM aTc/5 mM arabinose). The transcription profiles are calculated as the average of three biological replicates measured on different days. Predicted transcription profiles are shown by red and blue lines corresponding to when the gate should be off and on, respectively, as calculated using Cello (Materials and Methods). To the left of the profiles, the genes that are expressed in each state are highlighted.
- Determination of the conversion factor between RPU measured via cytometry and the expression of the yfp gene measured by RNA‐seq. The black line shows the linear fit. The averages and standard deviations were calculated from three replicates measured on different days.
- Comparison of the expression of circuit genes predicted by Cello and measured experimentally from the transcription profile (Materials and Methods). Black line shows x = y. The averages and standard deviations were calculated from three replicates measured on different days.
