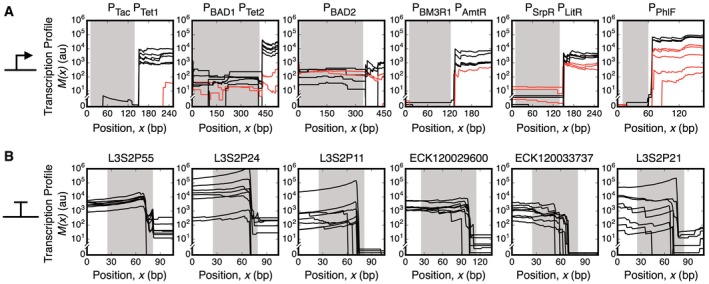
Figure 3. Quantifying part function.

-
A, BAlignment of transcription profiles for promoters (A) and terminators (B). Lines show the transcription profile for each of the eight combinations of inducers. Shaded regions denote the boundaries of the part. The lines are black for states where the promoter should be on and red when it should be off. The data are shown for the profiles derived from a single experiment (part parameterization from three replicates is provided in Table 1).
