
Figure 4. Extraction of sensor and gate response functions from the transcription profiles.
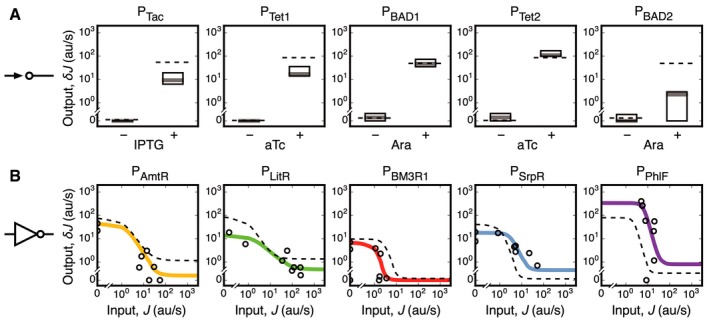
- The responses of the output promoters of the sensors are shown in the presence and absence of each inducer. The dashed lines show the sensor outputs measured in isolation (Nielsen et al, 2016). The boxes show the median (gray line) and range of promoter activities measured for the four states where it is off (δJ off) and four where it is on (δJ on).
- Solid colored lines show the response functions of the gates obtained by fitting the promoter activities to the RNA‐seq data (circles denote the measured values for the eight input states). The dashed lines show the output of the gate measured in isolation (Nielsen et al, 2016). The data are shown for the profiles derived from a single experiment (device parameterization from three replicates is provided in Table 2).