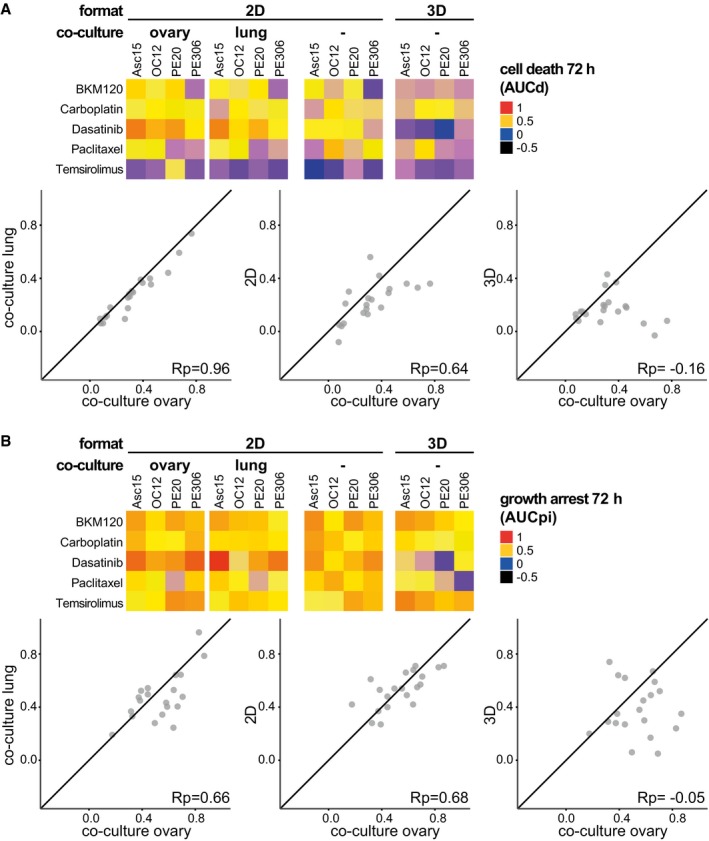
Figure EV5. Patient drug responses in 2D co‐cultures resemble responses in 2D monocultures and not 3D organoid cultures.

- Drug‐induced cell death is similar in co‐cultures with human ovary or lung fibroblasts. Cytotoxicity observed in co‐cultures correlates stronger with cytotoxicity in 2D than in 3D cultures. Heat maps depict cell death induced in four OC cell lines in 2D or 3D cultures and co‐cultures.
- Drug‐induced cell death correlates strongly between OC co‐cultures with human ovary or lung fibroblasts. Growth arrest in co‐cultures resembles drug response in 2D monocultures but not 3D cultures. Heat maps depict growth arrest induced in four OC cell lines in 2D or 3D cultures and co‐cultures.
