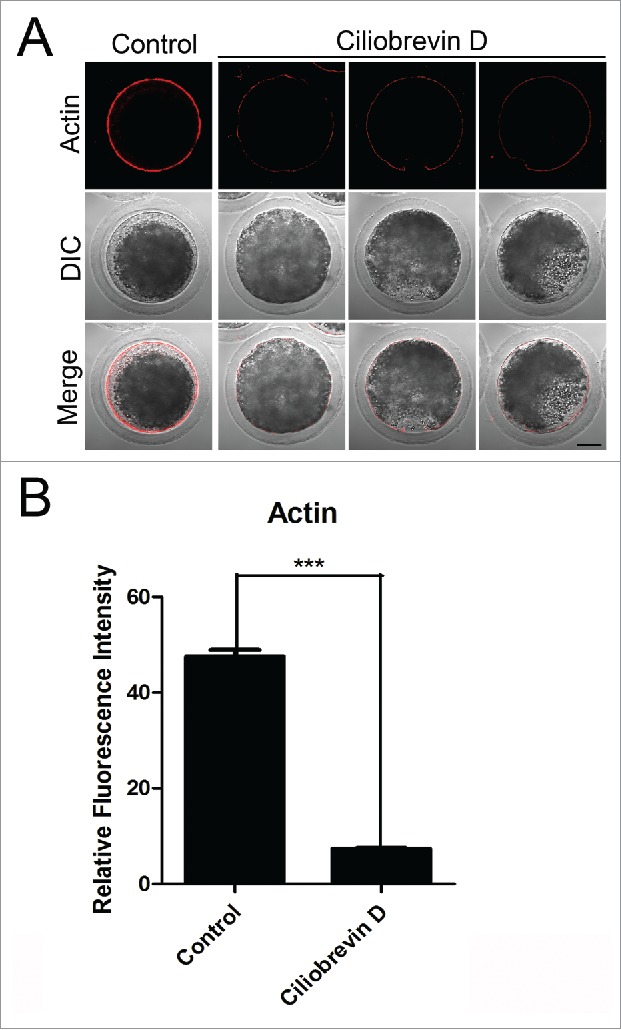
Figure 4.

Effect of dynein inhibition on the actin dynamics in porcine oocytes. (A) Representative images of actin filaments in control and Ciliobrevin D-treated oocytes. Oocytes were immnunostained with anti-phalloidin-TRITC antibody to visualize the actin filaments. Scale bar, 20 μm. (B) The fluorescence intensity of actin was measured in control and Ciliobrevin D-treated oocytes. Data were presented as mean percentage (mean ± SEM) of at least three independent experiments. Asterisk denotes statistical difference at a p < 0.05 level of significance.
