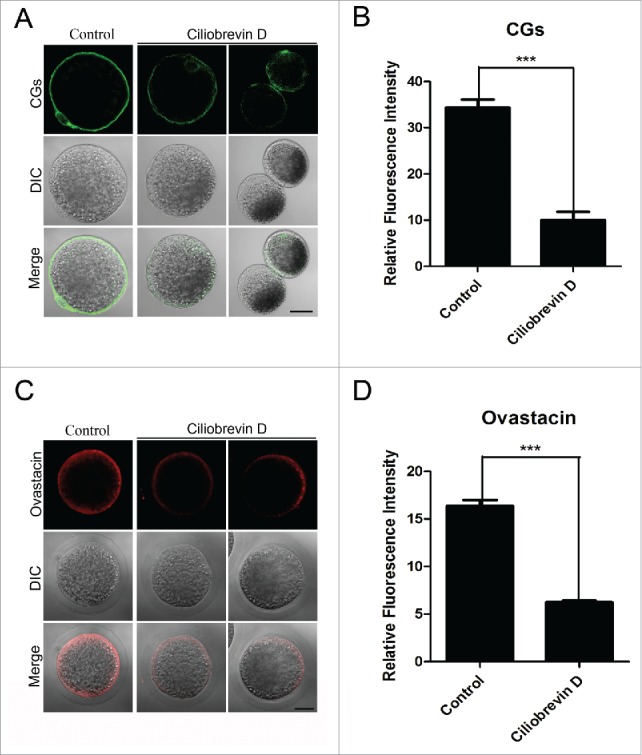
Figure 5.

Effect of dynein inhibition on the distribution of cortical granules and ovastacin in porcine oocytes. (A) Representative images of cortical granule localization in control and Ciliobrevin D-treated oocytes. Oocytes were immnunostained with LCA-FITC to visualize the cortical granules. Scale bar, 20 μm. (B) The fluorescence intensity of cortical granules was measured in control and Ciliobrevin D-treated oocytes. (C) Representative images of ovastacin localization in control and Ciliobrevin D-treated oocytes. Ovastacin was immunostained with rabbit polyclonal anti-human ovastacin antibody and imaged by confocal microscopy. Scale bar, 20 μm. (D) The fluorescence intensity of ovastacin was measured in control and Ciliobrevin D-treated oocytes. Data in (B) and (D) were presented as mean percentage (mean ± SEM) of at least three independent experiments. Asterisk denotes statistical difference at a p < 0.05 level of significance.
