
Figure 1.
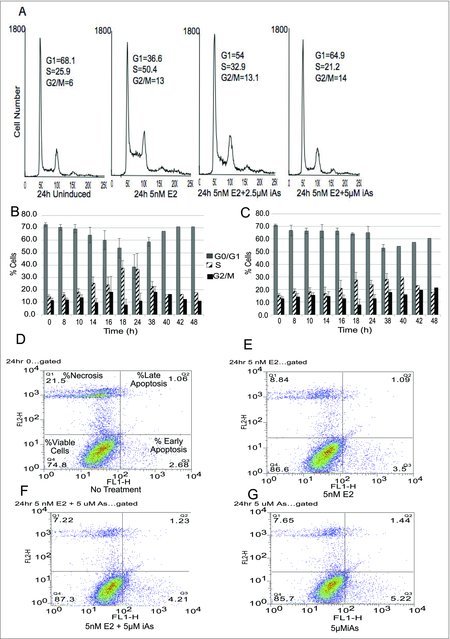
Treatment of MCF-7 cells with iAs blocks cells in G1/S and G2/M transitions. (A) Quiescent cells were left untreated, or treated with 5 nM E2, E2 + 2.5 µM iAs, or E2 + 5 µM iAs for 24 hours, stained with propidium iodide, and analyzed by flow cytometry. Values indicated by “G1, S, and G2/M” shown on the graphs are percent cells found in each phase. Representative experiment shown, repeated 4 times. (B) Cells treated with 5 nM E2 and analyzed as in (A) for indicated times. (C) Cells treated with 5 nM E2 +5 µM iAs and analyzed as in (A) for indicated times. Both B & C show means and SEM (n = 3 individual experiments) for 0–38 h. No error bars are shown for 40–48 h because these points represent one experiment. (D-G) Flow analysis of MCF-7 cells treated for 24 h to determine the distribution of apoptotic vs. necrotic cells with No Treatment (D), 5 nM E2 (E), 5 nM E2 + 5 µM iAs (F) and 5 µM iAs alone (G). Quadrant labels indicated in (D) are the same in (E-G).