
Figure 4.
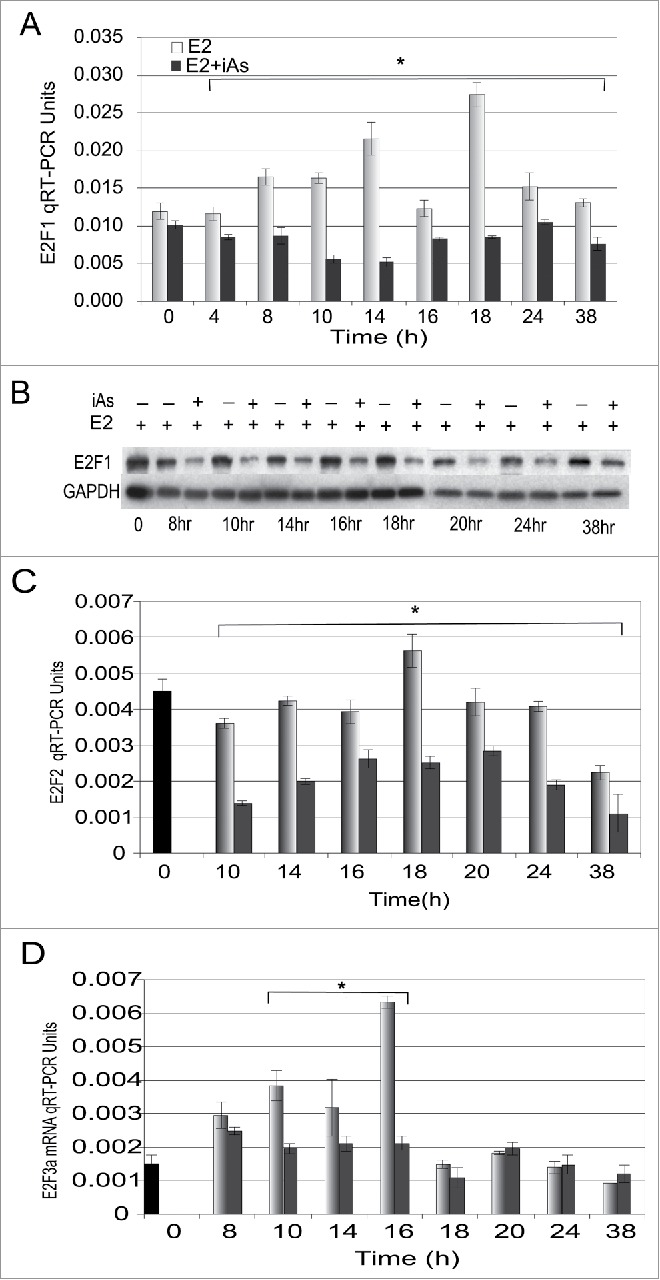
Expression of E2F1 mRNA and protein and E2F2 and E2F3 mRNA changes during the cell cycle following treatment with 5 nM E2 or 5 nM E2 + 5 µM iAs. (A) Quiescent cells were treated for indicated times and expression of E2F1 mRNA was measured by qRT-PCR. (n = 3; Error bars = SEM; *p-Value < 0.001 at 4–38 h). (B) Western blot analysis of E2F1 protein expression at times after treatment with 5 nM E2 ± 5 µM iAs. GAPDH is a loading control. (C) As in (A) but qRT-PCR was with primers to E2F2. Shown is a representative experiment repeated 3 times. (n = 3; Error bars = SEM; *p-Value < 0.001 at 10–38 h) (D) As in (A) but with primers to E2F3a. Shown is a representative experiment repeated 3 times. (n = 3; Error bars = SEM; *p-Value < 0.001 at 10–16 h). In (C) and (D) Black bar = Time zero, Light Gray = 5 nM E2, Dark Gray = 5 nM E2 + 5 µM iAs.