
Figure 6.
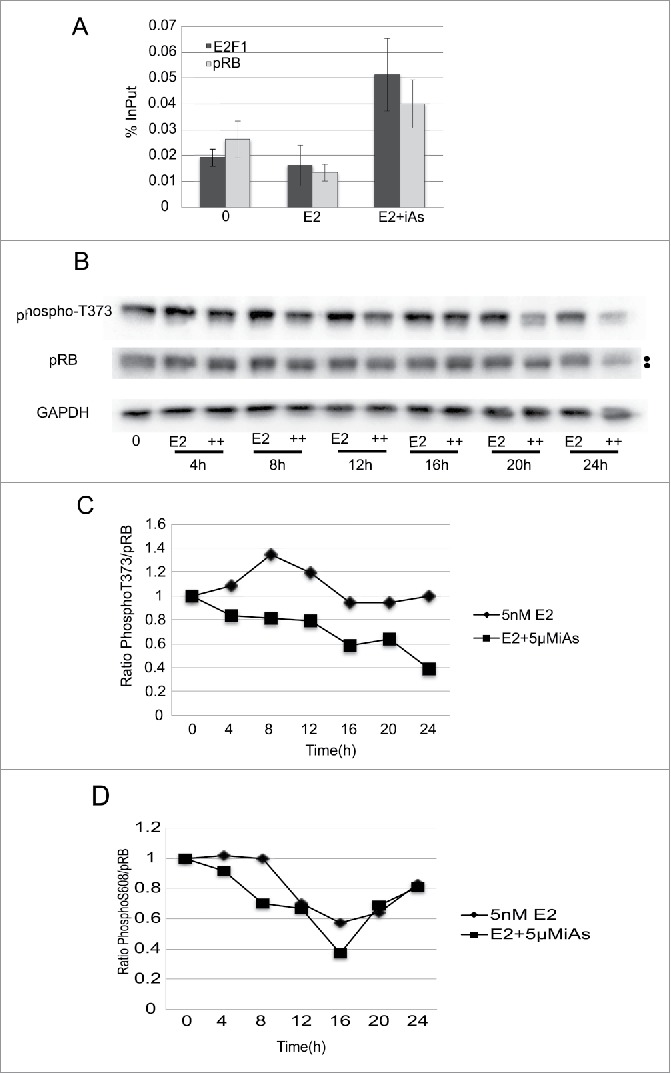
E2F1 and pRB heterodimerize at the E2F1 promoter in association with a decrease in pRB phosphorylation. (A) ChIP analysis of pRB and E2F1 bound to the E2F1 promoter after 16h treatment of cells with 5nME2 ± 5 µM iAs expressed as % InPut E2F1. Representative experiment, repeated twice, Error Bars = SEM from qRT-PCR triplicate analysis. (B) Western blot analysis of pRB and phosphor-T373 pRB across the cell cycle in cells treated with 5nM E2 ± 5 µM iAs. GAPDH is a loading control. Dots to the left indicate mobility changes in pRB. (C) Quantification of western blot shown in (B) with phosphor-T373 in each lane normalized to the amount of pRB expressed in the corresponding lane (ratio T373/pRB). Blot was hybridized with antibody to pRB, stripped and re-hybridized with antibody to T373. GAPDH is a loading control. (D) Quantification of western blot (not shown) incubated with antibody to phosphor-S608-pRB normalized to the amount of pRB expressed in the corresponding lane as in (B)(ratio S608/pRB). Blot was hybridized to antibody to pRB, stripped and re-hybridized with antibody to S608-pRB. GAPDH is a loading control. Both (C) and (D) experiments were repeated 3 times.