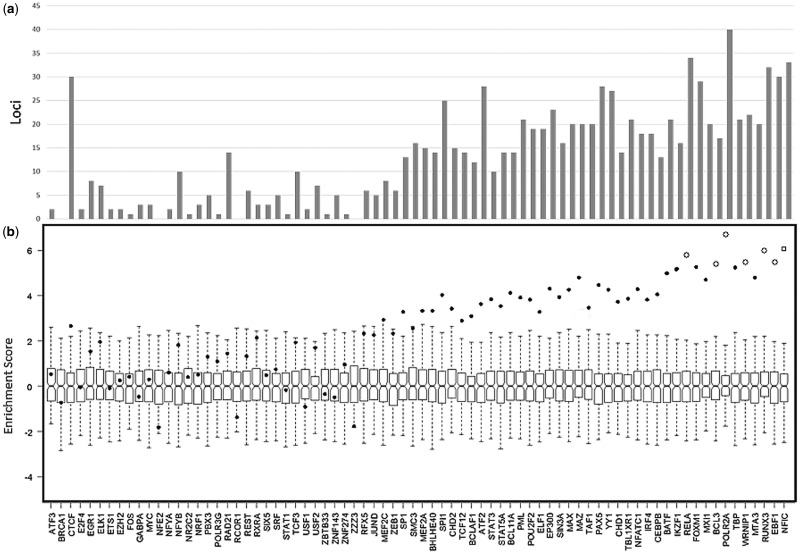
Figure 2.
Variant set enrichment analysis of 76 transcription factors (TFs) in GM12878. (a) Number of SLE loci enriched in each TF (x-axis). (b) Enrichment score for each TF, boxplots for all permutations of enrichment analysis. Dots represent enrichment score for each TF. Empty circles represent all TFs that passed 5 × 10⁻⁸ enrichment P-value.

