Figure 2.
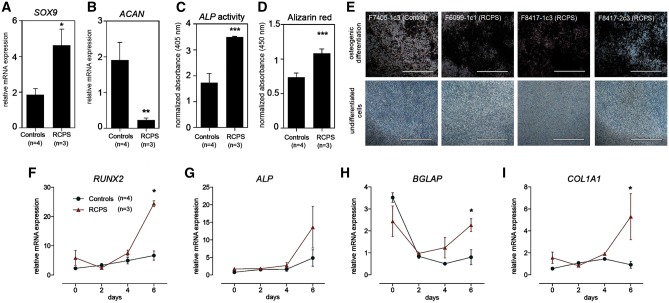
Alterations in osteogenic potential in RCPS nMSCs. (A, B) RT-qPCR assessment of SOX9 (A), ACAN (B) in nMSCs from controls and RCPS patients. (C) Quantification of alkaline phosphatase (ALP) enzymatic activity, after 9 days, and (D) alizarin red after 21 days of osteoinduction, in RCPS cells in comparison to controls. Measurements from differentiated cells were normalized to paired, undifferentiated negative staining controls. (E) Representative alizarin red staining micrographs showing matrix mineralization (in dark brown) of RCPS samples vs. one representative control (osteogenic differentiation); micrographs are shown paired to respective negative controls (undifferentiated cells). (F–I) Transcriptional profile of osteogenesis markers (RUNX2, ALP, BGLAP and COL1A1) during the initial 6 days of osteoinduction. All values represent mean ± SEM, and sample numbers (n) are indicated. (A, B) Two-way ANOVA with Bonferroni post-tests; (F-I) Student’s t-test; *P-value <0.05, **P-value <0.01, ***P-value <0.001, Scale bars, (E) 1000 µm.

