Figure 4.
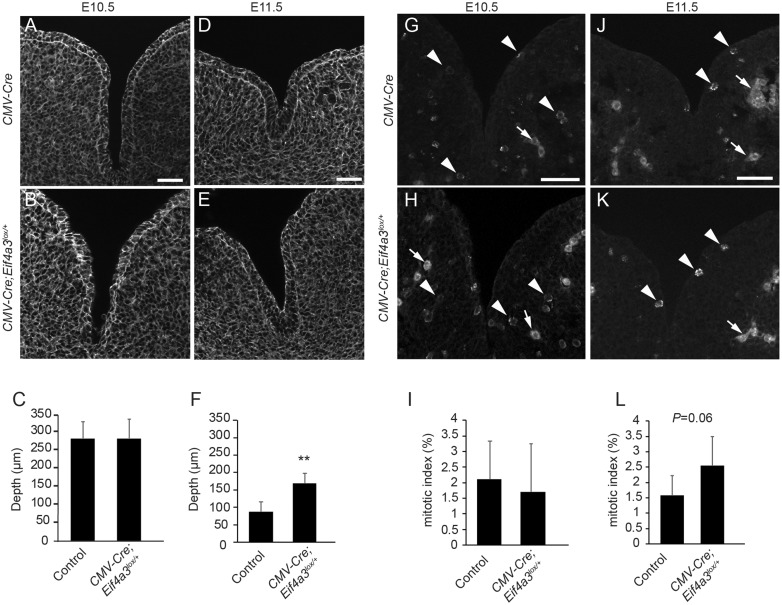
Mandibular formation defects in ubiquitous Eif4a3 haploinsufficient embryos. Images depicting phalloidin staining to highlight cell architecture of mandibular prominences in CMV-Cre (A, D) and type A Cmv-Cre; Eif4a3l°x/+embryos (B, E), at E10.5 (A, B, n = 6 controls, n = 3 mutants) and E11.5 (D, En = 4 controls, n = 5 mutants). (C, F) Graphs depicting average quantification of mandible clefts at E10.5 (C) and at E11.5 (F) for indicated genotypes. Images depicting PH3 staining in E10.5 CMV-Cre (G) and type A Cmv-Cre; Eif4a3l°x/+embryos (H) at E10.5 (G, H, n = 6 controls, n = 4 mutants) and E11.5 (J, K, n = 4 controls, n = 5 mutants). Arrowheads point to mitotic figures while arrows point to background vasculature. (I, L) Graphs depicting average quantification of mitotic index at E10.5 (I) and at E11.5 (L) for indicated genotypes. Error bars, SD, **P < 0.005, Student’s t-test, scale bars, 50 µm.

