
Fig. 4. XPA dependent changes in gene expression pattern.
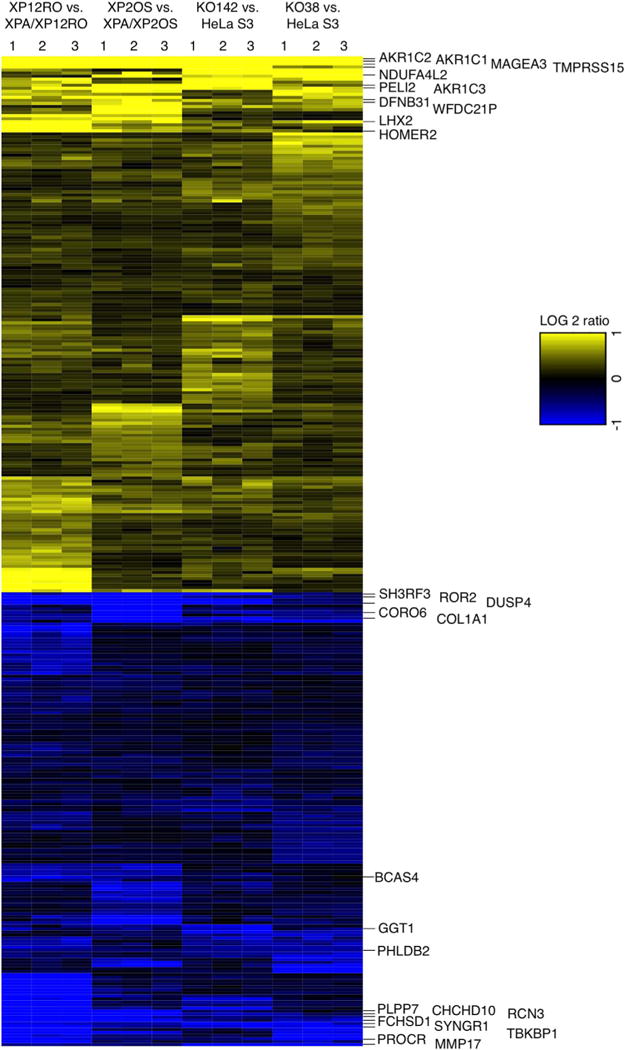
Heatmap of the 325 genes (Table 1) having the same expression pattern, either high (yellow) or low (blue), comparing all four pairs of cell lines, at a cut off level of FDR 0.05. Differential expression of mRNA was obtained from high throughput RNA-Seq data. Three biological replicate experiments were analyzed for each cell line pair and are numbered on the top of the heatmap. The ratio of gene expression was calculated for XPA+/XPA− for each cell pair; positive log 2 values are termed “high” and negative log 2 values are termed “low”. The most differentially over- or under-expressed genes summarized in Table 3 are shown at the right.