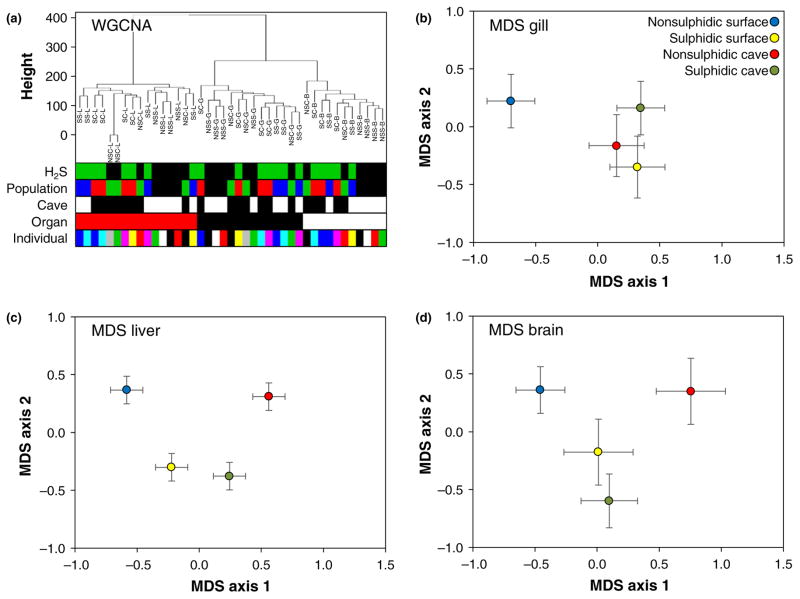
FIGURE 2.
(a) Results of the weighted gene coexpression network analysis (WGCNA) indicated that gene expression variation among samples was primarily driven by organ type (see Table 1). (b–d) MDS on each organ separately revealed significant differences in gene expression patterns among fish from different habitat types. MDS plots depict mean scores along axes 1 and 2 (± standard error). Data from different habitat types are colour-coded as indicated in the legend in panel (b) [Colour figure can be viewed at wileyonlinelibrary.com]

