
Figure 2. ΔF/F Responses to Different Social Stimuli.
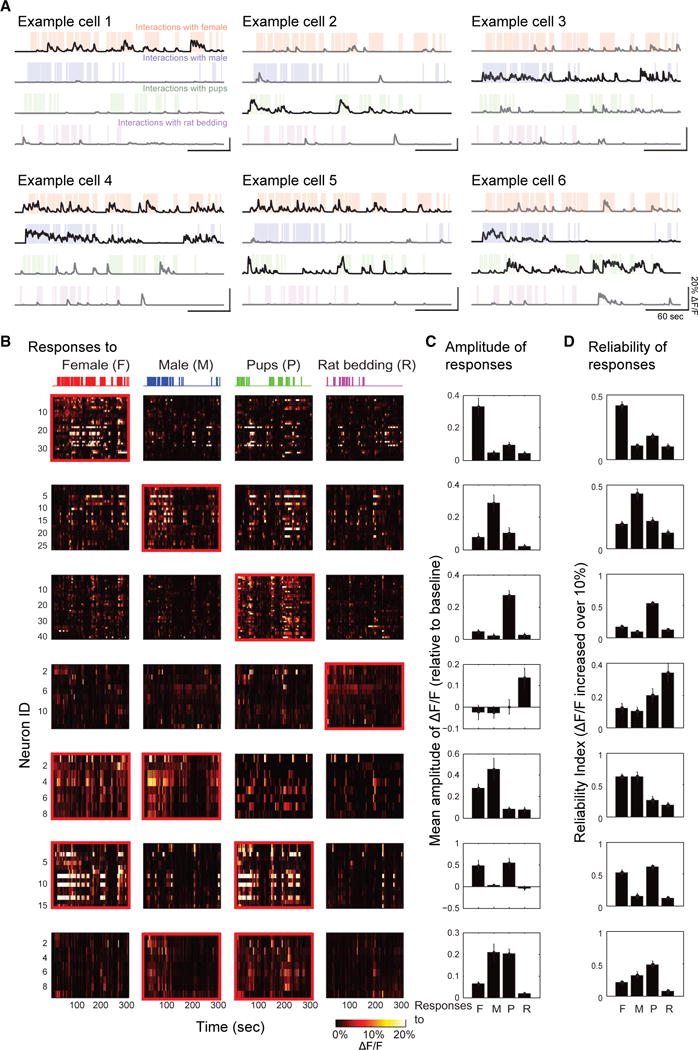
(A) Examples of neurons responsive to one stimulus (example cells 1, 2, 3) or multiple stimuli (example cells 4,5,6) in mice presented with adult female (red), adult male (blue), pups (green), and soiled bedding of adult male rat (magenta). Colored shadings represent occurrences of social interactions with each stimulus. Black traces represent neuronal activities that are temporally locked to contacts with the stimulus. Gray traces represent neuronal activities that are uncorrelated with behavioral contacts.
(B) ΔF/F amplitudes for different stimuli in all neurons with increased activity responding to at least one social stimulus (highlighted by red rectangular) in one mouse during a 1 day session. Colored bar graphs on top represent occurrences of social interactions with each stimulus.
(C and D) Mean response amplitudes in all epochs (C) and epoch-by-epoch reliabilities of mean DF/F increased above 10% (D) relative to baseline of different subsets of neurons responding to one stimulus or multiple stimuli (mean ± SEM).