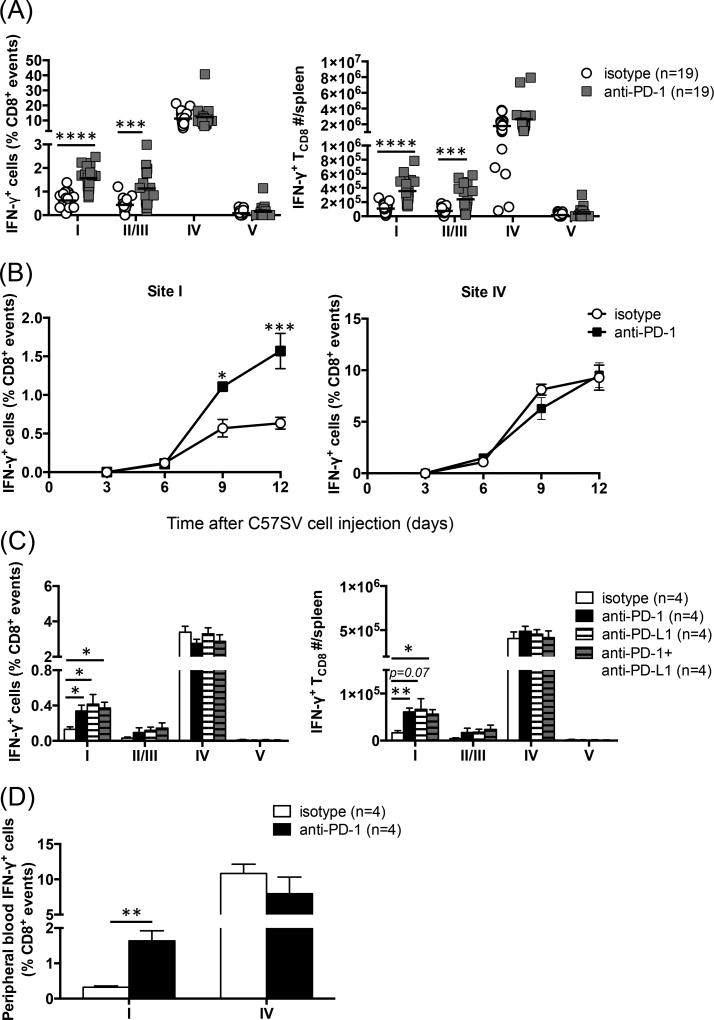
Fig. 3.
Blocking PD-1-PD-L1 interaction increases the frequencies and absolute numbers of IFN-γ-producing subdominant TCD8. (A) Mice were primed with C57SV cells and treated with 3 separate doses of an anti-PD-1 mAb or isotype control (n=19 per group). Nine days later, the percentages of sites I- , II/III, IV- and V-specific TCD8 (A; left panel) and their absolute numbers (A; right panel) in each spleen were determined by ICS for IFN-γ. Each circle or square represents an individual mouse. *** and **** denote statistical differences with p<0.001 and p<0.0001, respectively, which were calculated by unpaired Student’s t-test. (B) Separate cohorts of mice were injected with C57SV cells and treated with anti-PD-1 or isotype control (n=4 per group). Sites I- and IV-specific TCD8 frequencies were determined at indicated time points by ICS. Statistical comparisons between anti-PD-1- and isotype-treated mice were performed by two-way ANOVA (p<0.05) with Holm-Sidak post-hoc analysis (* and *** denote p<0.05 and p<0.001, respectively). (C) C57SV-primed mice were treated with anti-PD-1, anti-PD-L1, or a combination of both mAbs, or isotype controls (n=4 per group). TCD8 responses to indicated epitopes were quantified by ICS for IFN-γ on day 9 post-priming. Student’s t-test was employed for statistical analyses, and * denotes p<0.05. Error bars (A–C) represent SEM. (D) B6 mice were injected with C57SV cells and treated with 3 doses of anti-PD-1 or isotype control (n=4 per group). Nine days after tumor cell injection, the frequencies of sites I- and IV-specific IFN-g-producing TCD8 among PBMCs were determined by flow cytometry. ** denotes a statistical difference with p<0.01.

