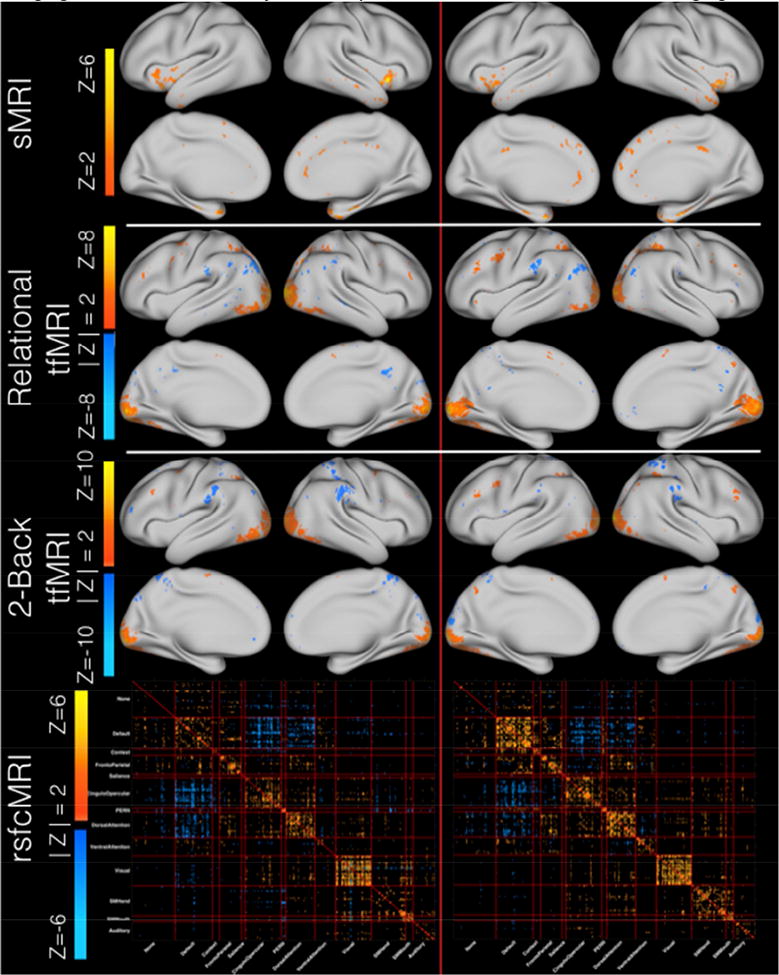
Figure 2. Imaging results for the similarity matched pair C1-IC2 and C2-IC3 for all four imaging modalities.

Figure 2 exhibits the spatial maps and correlation matrices that comprise Cohort 1's IC2 (left column) and Cohort 2's IC3 (right column). Modalities are the same across each row. All data are shown thresholded at |Z| > 2 with the exception of sMRI which is shown at Z > 2. For sMRI, the non-z-scored spatial maps were fully positive (Fig. S5). When Z-scored, the distribution was shifted to zero mean and thus only vertices where the signed Z-score value exceeded positive two are displayed, as the negatively valued Z-scored vertices represent those vertices that had the smallest magnitudes. Each modality is scaled independently to the minimum and maximum Z-value within a given modality for both cohorts in order to illustrate the strongest contributing vertices \ correlations within a given modality. Larger comparison images and the corresponding overlap masks are available in the supplement (Figs S5-12).
