
Figure 3. Scatter plots of cognitive control composite measure and subject-specific imaging weights for Cohort 1 independent component 2, Cohort 2 independent component 3, and the replication by prediction analysis for Cohort 1 independent component 2 predicting Cohort 2.
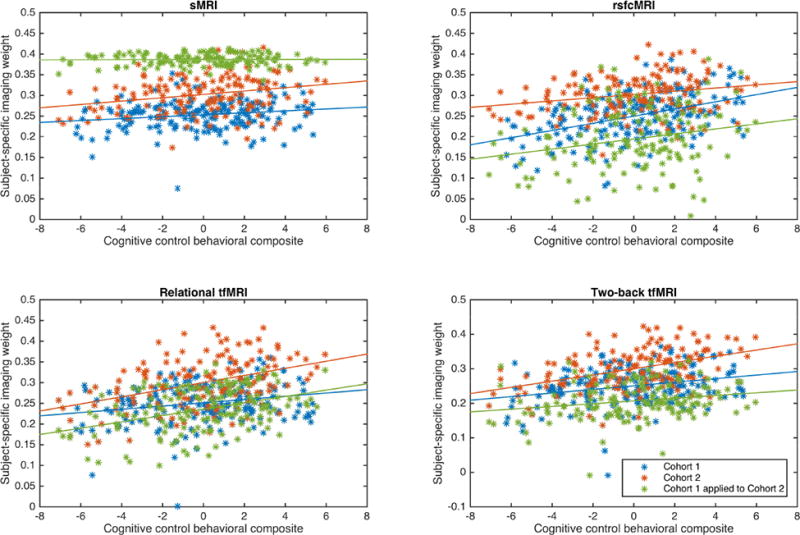
Panels show the scatterplots and linear trendlines between the cognitive control behavioral composite and the subject-specific imaging weights on the respective imaging modality. Blue data are from Cohort1; red data from Cohort2; and green data from the application of Cohort 1's ICs to Cohort 2's source imaging data. All correlations were statistically significant after FDR correction except for sMRI data in green (see text for values).