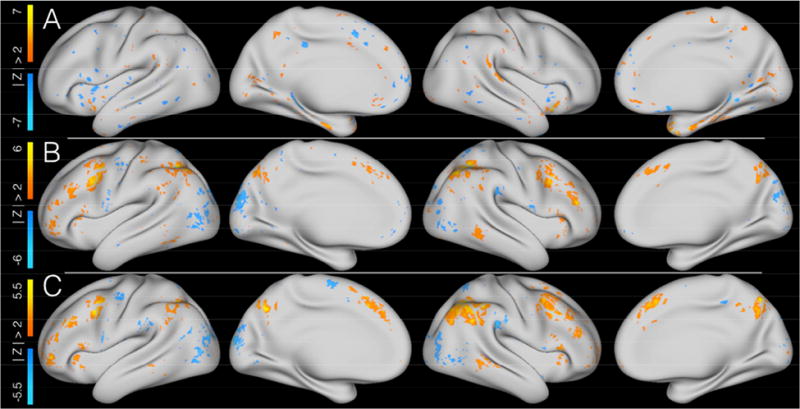
Figure 4. Imaging results for the modalities that significantly correlated with behavior in Cohort 1's independent component 7.

Figure 4 shows the three modalities within Cohort 1's independent component 7 that significantly correlated with cognitive control performance. All images show Z-scores of the IC spatial maps for a given modalities' data and are thresholded at |Z| > 2. A = cortical thickness; B = relational tfMRI; C = 2-back tfMRI.
