
Fig. 6.
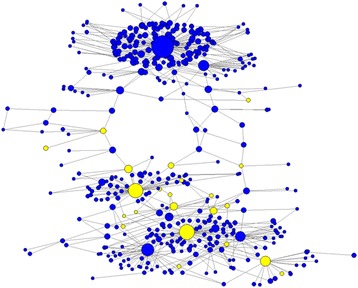
k-step network of the variants found in the source. Yellow nodes represent variants with a transmissibility value in the top 5%. The size of the node is proportional to the square root of the variant frequency
Official websites use .gov
A
.gov website belongs to an official
government organization in the United States.
Secure .gov websites use HTTPS
A lock (
) or https:// means you've safely
connected to the .gov website. Share sensitive
information only on official, secure websites.
k-step network of the variants found in the source. Yellow nodes represent variants with a transmissibility value in the top 5%. The size of the node is proportional to the square root of the variant frequency