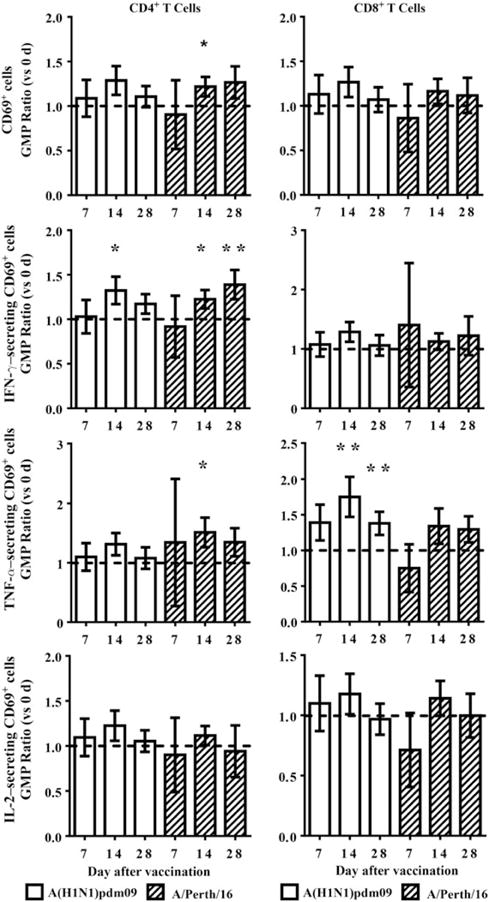
Figure 2.

T-cell responses to live-virus stimulation. Cytokine production by activated (CD69+) T cells induced by live-virus stimulation were assessed prior to (0 days) and either 7, 14, or 28 days after vaccination with 2010–2011 trivalent inactivated influenza vaccine. Geometric mean percentage (GMP) ratios vs 0 days were calculated for each time point after vaccination, using repeated measures linear mixed models. A GMP ratio of >1 (line) is indicative of a higher postvaccination response. T-cell activation is expressed as CD4+CD69+ or CD8+CD69+ cells in total CD4+ or CD8+ T cells. Cytokine-producing cells are expressed as percentages of total CD4+CD69+ or CD8+CD69+ T cells. Error bars represent 1 standard error. *P ≤ .05 and **P ≤ .01.
