Abstract
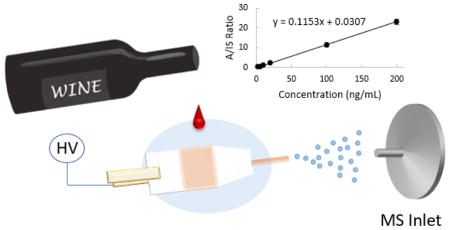
Fungicides are widely used for growing the grapes that are used for making wines. Chromatography coupled with tandem mass spectrometry is usually time and labor consuming for quantitation of fungicides in wines. In this work, a simple ambient mass spectrometry method using paper capillary spray was developed for the fast quantitation of four pyrazole fungicides in wines. Direct analysis of the wine samples was achieved without any sample preparation, obtaining limits of quantitation as low as 2 ng/mL for all four pyrazole fungicides. Quality control experiments also showed adequate accuracy and precision for the analysis of pyrazole fungicides in wine products.
Keywords: Food safety, paper capillary spray, mass spectrometry, grape wines, pyrazole fungicides
Graphical Abstract
Introduction
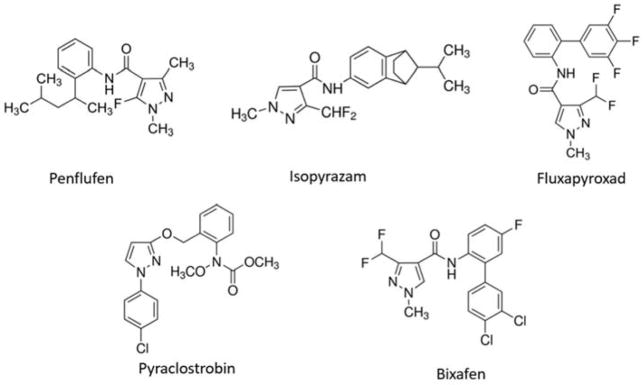
Wine is one of the most popular beverages around the world. During the process of growing wine grapes, attack by fungal pathogens can lead to plant diseases such as Alternaria alternate and Botrytis cinerea. Therefore, fungicides have been widely applied to control the fungal pathogens. The sterol biosynthesis inhibitors and quinone-outside inhibitors (QoIs) are the major types of fungicides commercially available on the market.1 Recently, a relatively new type of fungicide, the succinate dehydrogenase-inhibitor (SDHI), has been increasingly used.2 These fungicides inhibit succinate dehydrogenase by binding strongly to the ubiquinone-binding site, which causes the disruption of cellular respiration. The most commonly used SDHI fungicides include penflufen (PEN), fluxapyroxad (FLU), isopyrazam (ISO), pyraclostrobin (PYRA) and bixafen (BIX) (Scheme 1). These fungicides have been quickly adopted due to their high-level activities, especially for fungi that have already developed resistance to some of the commonly used fungicides, such as QoIs.1 The fungicides are usually directly sprayed onto the grapes and vines, and they are fairly stable in water and soil. The fungicide residues on grape skins could certainly be carried over to the wine products. To address the concerns about their threats to human health, maximum residue levels (MRLs) have been established for these fungicides. For example, the European Union (EU) residue limits are set at 0.01 mg/kg for PEN, FLU, ISO and BIX, and 0.02 mg/kg for PYRA in wine grapes.3 To enforce the regulatory control, it is important to develop analytical methods for quantifying fungicide residues in wines for product inspection.
Scheme 1.
Chemical structures of five pyrazole fungicides.
Current methods for the analysis of fungicides are mostly based on chromatographic separation (such as gas chromatography (GC) or liquid chromatography (LC)) coupled with tandem mass spectrometry (MS/MS). The LC-MS/MS is one of the most reliable and widely used methods for measuring agrochemical residues.4, 5 Modified QuEChERS (quick, easy, cheap, effective, rugged, and safe) extraction methods, followed by ultra-performance LC-MS/MS, were used to determine SDHI fungicides in fruits and vegetables.2 In another method demonstrated, online solid-phase extraction (SPE) was used for sampling, followed by LC-MS/MS method for analyzing SDHI fungicides in surface water samples to estimate water contamination, with a limit of detection (LOD) as low as 0.1 ng/L.6
Despite the good analytical performance achieved by these methods, comprehensive sample preparation and separation procedures are still required, which are labor and time consuming, causing delays in getting results for the inspection. In this study, we explored the use of ambient ionization method for direct analysis of the fungicides in wines, which promises significantly improved analysis speed and extremely low cost. Ambient ionization techniques have been well developed in the last decade. Starting with desorption electrospray ionization (DESI)7 and direct analysis in real time (DART)8, more than 40 methods have been developed, including extractive electrospray ionization (EESI)9, low-temperature plasma (LTP)10, and many others11–21. One of the benefits provided by these techniques is the greatly improved throughput with the sample preparation eliminated or significantly simplified. Paper spray and its variants have been developed in recent years22–24, with a series of applications developed for quantitative analysis. To perform paper spray, a piece of chromatography paper is cut to a triangle, which is then loaded with the sample and extraction solvent. When a high voltage is applied to the paper, a spray is formed at the tip of the paper triangle, and the analyte molecules extracted from the sample by the solvent are ionized. Paper spray has been applied to the quantitation of therapeutic drugs25 and drugs of abuse26 in biofluid samples, as well as contaminants in foodstuffs27–29.
The analysis of agrochemicals has been a major application for ambient ionization mass spectrometry. Paper spray has been applied to the detection of agrochemicals. In a recent demonstration, the method was compared with leaf spray for fast screening.30 Both methods showed good quantitative performance for analyzing atrazine, diuron and methomyl at ppb level. DART-MS/MS was also investigated for the screening of 50 residual pesticides and 12 illegal adulterants in red wine, following a modified QuEChERS procedure.31 LOQs obtained ranged between 1 and 100 ng/mL for pesticides and 10 and 250 ng/mL for different adulterants. Other examples include the use of paper spray for analyzing herbicides32, wooden-tip electrospray ionization (ESI) for toxic and hazardous compounds in food samples,33 thermal desorption ESI for pesticide residuals in food stuff,34 and DESI for distribution of pesticides on leaf surfaces.35 LTP was also previously used to detect five classes of fungicides,36 but excluding the pyrazole fungicides. LODs at parts-per-billion levels were obtained, meeting the MRL requirement. Its capability for quantitative analysis has not yet been demonstrated.
In a recent study, paper capillary spray37 was developed with a capillary sprayer embedded into the paper substrate for improved spray ionization. Thicker paper substrate could now be used to allow higher loads of sample and extraction solvent. More flexibility was also allowed in the selection of the paper substrate geometry for the design of disposable sample cartridges. The paper capillary spray was successfully used with mass spectrometers using an atmospheric pressure interface with curtain gases, which used to be problematic for paper spray.38
In this work, paper capillary spray ionization was used with a triple quadrupole mass spectrometer to perform the fast detection and quantitation of four pyrazole fungicides (PEN, ISO, PYRA, FLU) in wine samples. No pretreatment of the samples was required, and the limits of quantitation (LOQs) were found to be 2 ng/mL for paper capillary spray. The fast speed, low cost, and adequate sensitivity of this method indicate its potential for the fast screening of contaminants in wines.
Materials and Methods
All the chemicals were purchased from Sigma-Aldrich (St. Louis, MO, USA) and used without further purification. Four different wines were purchased from local supermarkets: Coteaux du Languedoc, Les Belles Tours, France (wine 1, red); Merlot, Terrasses D’Azur, France (wine 2, red); Viognier, La Garelle, France (wine 3, white); Cabernet Sauvignon, Yellow Tail, Australia (wine 4, red). Grade 31ET and grade 1 chromatography papers were purchased from Whatman (Whatman International, Maidstone, UK). Fused silica capillaries with outer diameter of 130 μm and inner diameter of 50 μm were purchased from Molex Inc. (Lisle, IL, USA).
Each of the four fungicide compounds was dissolved into methanol to make concentrated stock solutions (1,000 μg/mL), which were then mixed together and subsequently diluted using the red wine to prepare samples at desired concentrations. Each calibration standard contained four fungicides at the same concentrations. BIX was spiked into all samples at a constant concentration of 200 ng/mL as the internal standard (IS). Final concentrations of fungicides in the matrix-matched calibration standards were 2, 5, 10, 20, 100, and 200 ng/mL.
MS analysis was performed using a TSQ Quantum Access Max (Thermo Scientific, San Jose, CA, USA) with a heated capillary. The capillary temperature was optimized and set at 200 °C for all quantitative studies. Multiple reaction monitoring (MRM) mode was used for quantitation, with an isolation window of m/z 1.0 and a scan time of 100 ms. A tube lens voltage of 100 V was used for all analytes without further optimization. Studies on matrix effect and the effect of the distance between capillary and MS inlet were performed using a LTQ XL (Thermo Scientific, San Jose, CA, USA), with the capillary temperature set at 200 °C and the tube lens voltage at 100 V. A scan method was established to monitor the product ions of PEN and BIX consecutively, with an isolation window of m/z 2.0 for the product ions. The MS analysis was performed in positive ion mode.
Results and Discussions
Setup for paper capillary spray
Paper spray has previously been extensively tested for direct, quantitative analysis. It was found that the thickness of the paper is critical for the stability of the spray off the paper tip. To improve repeatability and ionization efficiency, especially for the coupling of mass spectrometers with atmospheric pressure interfaces using curtain gases, paper capillary was developed. Thicker paper substrate can now be used to hold samples of higher volumes, while a stable spray can still be maintained with the capillary tip. A detailed study with comparisons between paper spray and paper capillary spray has been previously published.37 To fabricate the spray device, grade 31ET chromatography paper (0.5 mm thickness) was first cut into a rectangular shape of 8 mm width and 15 mm height, with the sharp corners trimmed to avoid direct sprays from the paper substrate (Figure 1). The capillary sprayers were made by cutting a fused silica capillary into short pieces of 10 mm length, which were then inserted into the 31ET paper with 5 mm in the substrate. Without the capillary emitter inserted, the signal intensity would drop at least two orders of magnitude in full scan mode during analysis of the wine samples (to be further discussed below).
Figure 1.
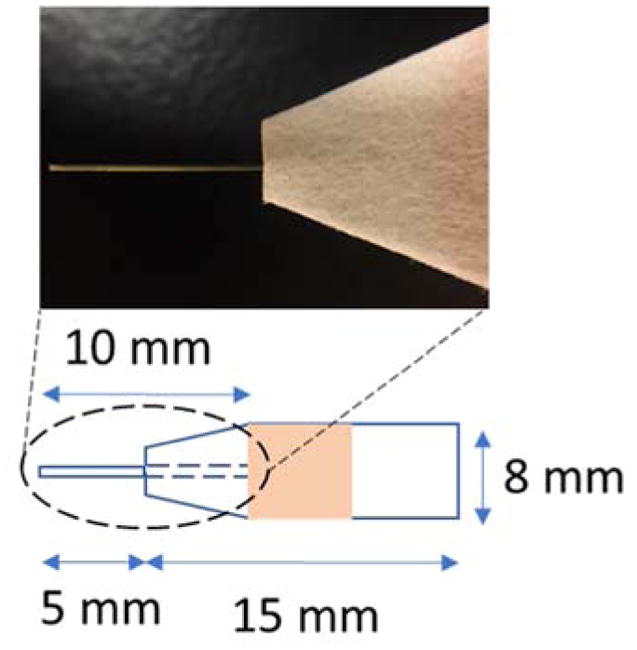
Photo and dimensions of a paper capillary spray device.
In the paper capillary spray ionization experiments, 10 μL wine sample was deposited onto the middle of the paper substrate (Figure 1) and then let dry to make a dried sample spot. This process can be expedited by using a heat gun. To analyze the dried sample spot, the paper device was held with an alligator clip and placed in front of the heated capillary of the mass spectrometer, with a distance of about 1 cm between the fused silica capillary and the MS inlet. Four different solvents were tested as the extraction spray, including methanol, acetonitrile, acetone and ethyl acetate. The highest intensity was obtained for analytes with pure methanol, which was subsequently adopted for all the following experiments. For MS analysis, 70 μL methanol was added to the rear end of the paper device as the elution and spray solvent, and a 2.5 kV DC high voltage was applied to the paper through the clip to initiate and sustain the spray. In the quantitative studies, the experiments were repeated three times for each sample.
Matrix effect
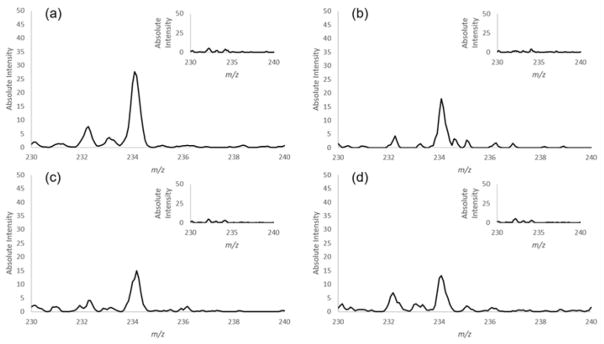
The potential matrix effect is a major concern for mass spectrometry analysis, and ambient ionization methods were developed to overcome it for direct analysis. PEN was spiked into methanol, wine 1, wine 2 and wine 3, each at a concentration of 10 ng/mL. MS/MS spectra were recorded for analysis using paper capillary spray, as shown in Figure S1 (see supplementary information) for PEN (m/z 318.3). The intensity of product ion m/z 234.1 from PEN was monitored for comparison. The results are shown in Figure 2. The inset MS/MS spectra were recorded for the corresponding blank matrices, showing no apparent peaks at m/z 234. Good signal-to-noise ratios are observed for all matrices. No significant difference was observed due to different sample matrices. Drying the wine samples on the paper prior to the analysis was expected to minimize the matrix effect.
Figure 2.
The effect of wine matrix on paper capillary spray. The matrices are (a) methanol, (b) wine 1, (c) wine 2 and (d) wine 3. Insets are spectra of blank matrices.
Effect of the distance between capillary and MS inlet
The distance between the capillary and the MS inlet (heated capillary) could potentially have a strong impact on the ion signal intensity. Methanol samples spiked with 200 ng/mL PEN and BIX were analyzed, and the signal intensities of product ions m/z 234 and m/z 394 were monitored. At a capillary–inlet distance of 5 mm, an offset larger than 8 mm from the inlet axis could result in a complete loss of the signal. Figure 3 shows the results for moving the tip of the capillary away from the MS inlet, between 5 and 30 mm. A longer distance would result in a lower signal intensity. When aligned with the inlet, the signal can be detected even at a distance of 50 mm, although the signal becomes unstable (data not shown). Despite the variation in signal intensity, the intensity ratio between PEN and BIX was rather stable (RSD = 11.5%), as shown in Figure 3(b); therefore, as long as a distance shorter than 30 mm is maintained, the quantitative performance should not be affected significantly. We used 10 mm for the following experiments.
Figure 3.
The effect of distance between the capillary and the MS inlet. (a) Product ion signals for PEN and BIX and (b) their ratio as a function of the distance between the capillary tip and MS inlet.
Effect of heated capillary temperature and spray voltage
The atmospheric pressure interface of the TSQ mass spectrometer has a heated capillary, which could mitigate the potential problem of insufficient desolvation that would negatively impact the ionization efficiency39. Studies were carried out to determine the optimal temperature for the heated capillary using a dried sample spot prepared with 200 ng/mL PEN in pure methanol. The heated capillary temperature was adjusted between 100 °C and 300 °C; the MS analysis was performed in MRM mode where both product ions at m/z 141.2 and m/z 234.1 of PEN were monitored. The absolute ion intensities of m/z 141.2 as a function of spray time were recorded at different temperatures. Figure 4(a) shows the ion chromatograms at the three temperatures of 100 °C, 200 °C and 300 °C. Higher temperatures yielded higher intensities, which could be expected due to the better evaporation of the spray solvent resulting in a more efficient formation of dry ions of the analytes. However, at a higher temperature, such as 300 °C, it also appeared that the spray became relatively unstable with more severe fluctuation. To obtain a relatively stable spray while maintaining sufficient intensity, the heated capillary temperature was set at 200 °C for the rest of the study.
Figure 4.
(a) Effect of heated capillary temperature on ion intensity. (b) Effect of high voltage on paper capillary spray and paper spray.
Paper capillary spray shares similar properties with paper spray in terms of using the paper substrate for real-time sample processing. The use of the capillary sprayer, however, provided unique flexibility for the design of sample cartridges. In previous studies, it was found that paper spray using 31 ET chromatography paper (0.5 mm thickness) could suffer low ionization efficiency in comparison with the grade 1 chromatography paper (0.18 mm thickness) due to the difference in the sharpness of the paper tip.37 The paper capillary spray provided ionization efficiency similar to the paper spray with thin paper substrate but could use thicker paper substrates for higher sample loads.37 In this work, we also studied the impact of the spray voltage on the paper capillary spray in comparison with paper spray, which usually requires a high voltage (3–5 kV).23 Figure 4(b) shows the ion intensities monitored for 200 ng/mL PEN in pure methanol analyzed using paper spray and paper capillary spray, each with a spray voltage varying from 1,000 V to 3,500 V. Both used the 31ET chromatography paper as the substrate. A triangle shape was adopted for paper spray, and the dimensions were similar to the paper capillary spray device, with the base width of 8 mm and height of 15 mm. In comparison with the voltage higher than 3,000 V required for paper spray, an optimal spray was obtained at 2,000 V for paper capillary spray, which is higher than that for nanoESI but similar to ESI. For the subsequent quantitative study, a spray voltage of 2,500 V was used for paper capillary spray.
Determination of the MRM parameters
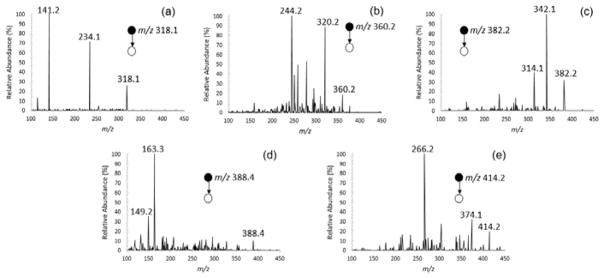
To determine the appropriate MRM transitions for the compounds of interest, MS/MS spectra were acquired using paper capillary spray ionization in product ion scan mode. The spectra are shown in Figure 5, and MRM parameters are summarized in Table 1. The precursor ions were the protonated ions at m/z 318.0, m/z 360.0, m/z 382.0, m/z 388.0 and m/z 414.0 for PEN, ISO, FLU, PYRA and BIX, respectively. For quantitative analysis, product ions of m/z 141.2, m/z 244.2, m/z 342.1, m/z 163.3, and m/z 266.2 were selected, respectively. These were the product ions with the highest observed intensity. Other product ions, such as m/z 234.1, m/z 320.2, m/z 314.1, m/z 149.2 and m/z 374.1, were also observed with relatively high intensities for the four fungicides, respectively, which potentially could also be used for MRM quantitation.
Figure 5.
MS/MS spectra of (a) PEN, (b) ISO, (c) FLU, (d) PYRA and (e) BIX.
Table 1.
MRM parameters
| Compounds | Molecular Weight | Precursor m/z | Product m/z |
|---|---|---|---|
| Penflufen | 317.4 | 318.0 | 141.2a, 234.1 |
| Isopyrazam | 359.4 | 360.0 | 244.2a, 320.2 |
| Fluxapyroxad | 381.3 | 382.0 | 342.1a, 314.1 |
| Pyraclostrobin | 387.8 | 388.0 | 163.3a, 149.2 |
| Bixafen | 414.2 | 414.0 | 266.2a, 374.1 |
Used for quantitation
Quantitation with Paper Capillary Spray
The quantitation was performed using MRM mode, with transitions of m/z 318.0 to 141.2, 360.0 to 244.2, 382.0 to 342.1, 388.0 to 163.3, and 414.0 to 266.2 for PEN, ISO, FLU, PYRA, and IS BIX, respectively. The fungicides were spiked into wine 4. This wine has been examined with a LC-MS/MS method to ensure that none of these fungicides were presenting in the wine before spiking. Besides PYRA, which was not examined, all of the other four fungicides did not present in wine 4 (see Figure S2). Figure S3 shows the calibration curves obtained for these four fungicides using paper capillary spray ionization mass spectrometry analysis. Table 2 summarizes the characteristics for the calibrations. The LOQs were determined as 2 ng/mL for all four fungicides, which are lower than the MRL levels set for these fungicides by the EU3. Good linearity was achieved in the concentration range of 2–200 ng/mL, with R2 value above 0.99 for all four fungicides. According to the slopes of the calibration curves, FLU shows the lowest sensitivity, which is probably attributed to its poorer ionization efficiency compared with the other three fungicides.
Table 2.
Analytical performance of paper capillary spray for the analysis of fungicides
| Compounds | Linearity Range (ng/mL) |
LOQ (ng/mL) |
Calibration Equation | Correlation Coefficient (R2) |
MRL (mg/kg) |
|---|---|---|---|---|---|
| Penflufen | 2–200 | 2 | y = 0.1153x + 0.0307 | 1.000 | 0.01 |
| Isopyrazam | 2–200 | 2 | y = 0.1040x + 0.2636 | 0.9996 | 0.01 |
| Fluxapyroxad | 2–200 | 2 | y = 0.0136x + 0.0681 | 0.9985 | 0.01 |
| Pyraclostrobin | 2–200 | 2 | y = 0.2276x + 0.0102 | 0.9996 | 0.02 |
Quality control experiments were also performed using samples prepared at three concentrations in the same way as for the calibration standards, viz. spiking standard solutions of four fungicides simultaneously into the wine, with 200 ng/mL BIX as the internal standard. Relative standard deviations (RSDs) were calculated to evaluate the precision of the method. Quality control data are listed in Table 3, with the ones marked bold not meeting the recommended requirements40 (precision and accuracy within 15%, except at LOQ, where ± 20% is acceptable). These results show that paper capillary spray has acceptable accuracy and precision, and thus can be used as a reliable method for fungicide quantitation in wine.
Table 3.
Quality control data, paper capillary spray, n = 3
| Compounds | Nominal Concentration (ng/mL) |
Accuracy (%) | Precision (RSD %) |
|---|---|---|---|
| Penflufen | 5 | 111.4 | 8.4 |
|
| |||
| 20 | 107.9 | 20.2 | |
|
| |||
| 100 | 113.3 | 12.7 | |
|
| |||
| Isopyrazam | 5 | 94.9 | 10.2 |
|
| |||
| 20 | 88.2 | 27.8 | |
|
| |||
| 100 | 87.0 | 9.7 | |
|
| |||
| Fluxapyroxad | 5 | 121.7 | 9.1 |
|
| |||
| 20 | 87.2 | 8.1 | |
|
| |||
| 100 | 88.4 | 9.7 | |
|
| |||
| Pyraclostrobin | 5 | 112.4 | 5.0 |
|
| |||
| 20 | 86.2 | 17.5 | |
|
| |||
| 100 | 79.5 | 9.6 | |
Four different wine samples were examined with paper capillary spray mass spectrometry, and none of the four pyrazole fungicides were detected.
Comparison with Other Methods
The SPE-GC-MS method was previously demonstrated for the fast screening of the fungicides with a high analytical performance.41 PYRA could be analyzed with a LOQ of 0.7 ng/mL and a linear range of 0.7–400 ng/mL; the RSDs obtained were within 5% for both intra-day and inter-day assays. This method has better sensitivity but still requires 23 minutes for the analysis of one sample. Recently, a GC-MS/MS method was developed for the simultaneous quantification of six pyrazole fungicides. SPE is required for sample preparation.42 The LOQs were 0.2 ng/g for FLU and BIX, and 0.8 ng/g for PEN and ISO. The linear range was 1–50 ng/mL. In comparison with these methods, the sampling and analysis procedure for paper capillary spray are significantly simpler and faster (shorter than 1 min), with adequate performance obtained. The amount of sample required is also significantly lower (10 μL vs. 10 mL for SPE-GC-MS).
Conclusions
Paper capillary spray mass spectrometry was used with a triple quadrupole mass spectrometer for the fast analysis of four pyrazole fungicides in wine. LOQs of 2 ng/mL were obtained for all four analytes, which are adequate for regulatory purposes. Quality control study showed acceptable accuracy and precision. This method does not require any sample preparation and purification, and it potentially could be widely applied for high-speed and high-throughput analysis for product inspection.
Supplementary Material
Acknowledgments
This research was supported by National Natural Science Foundation of China (Project 21627807) and the National Institutes of General Medical Sciences (Project 1R01GM106016) of the National Institutes of Health, USA.
References
- 1.Sierotzki H, Scalliet G. Phytopathology. 2013;103:880–887. doi: 10.1094/PHYTO-01-13-0009-RVW. [DOI] [PubMed] [Google Scholar]
- 2.Abad-Fuentes A, Ceballos-Alcantarilla E, Mercader JV, Agullo C, Abad-Somovilla A, Esteve-Turrillas FA. Analytical and bioanalytical chemistry. 2015;407:4207–4211. doi: 10.1007/s00216-015-8608-3. [DOI] [PubMed] [Google Scholar]
- 3. [accessed February, 2017];EU Pesticide Database. http://ec.europa.eu/food/plant/pesticides/eu-pesticides-database/public/?event=activesubstance.selection&language=EN.
- 4.Andersen WC, Turnipseed SB, Karbiwnyk CM, Clark SB, Madson MR, Gieseker CA, Miller RA, Rummel NG, Reimschuessel R. J Agric Food Chem. 2008;56:4340–4347. doi: 10.1021/jf800295z. [DOI] [PubMed] [Google Scholar]
- 5.Vidal JLM, Aguilera-Luiz MD, Romero-Gonzalez R, Frenich AG. J Agric Food Chem. 2009;57:1760–1767. doi: 10.1021/jf8034572. [DOI] [PubMed] [Google Scholar]
- 6.Gulkowska A, Buerge IJ, Poiger T. Analytical and bioanalytical chemistry. 2014;406:6419–6427. doi: 10.1007/s00216-014-8073-4. [DOI] [PubMed] [Google Scholar]
- 7.Takats Z, Wiseman JM, Gologan B, Cooks RG. Science. 2004;306:471–473. doi: 10.1126/science.1104404. [DOI] [PubMed] [Google Scholar]
- 8.Cody RB, Laramee JA, Durst HD. Anal Chem. 2005;77:2297–2302. doi: 10.1021/ac050162j. [DOI] [PubMed] [Google Scholar]
- 9.Chen H, Wortmann A, Zhang W, Zenobi R. Angewandte Chemie. 2007;46:580–583. doi: 10.1002/anie.200602942. [DOI] [PubMed] [Google Scholar]
- 10.Harper JD, Charipar NA, Mulligan CC, Zhang XR, Cooks RG, Ouyang Z. Anal Chem. 2008;80:9097–9104. doi: 10.1021/ac801641a. [DOI] [PubMed] [Google Scholar]
- 11.Na N, Zhao M, Zhang S, Yang C, Zhang X. J Am Soc Mass Spectrom. 2007;18:1859–1862. doi: 10.1016/j.jasms.2007.07.027. [DOI] [PubMed] [Google Scholar]
- 12.Nemes P, Vertes A. Anal Chem. 2007;79:8098–8106. doi: 10.1021/ac071181r. [DOI] [PubMed] [Google Scholar]
- 13.Ratcliffe LV, Rutten FJM, Barrett DA, Whitmore T, Seymour D, Greenwood C, Aranda-Gonzalvo Y, Robinson S, McCoustra M. Anal Chem. 2007;79:6094–6101. doi: 10.1021/ac070109q. [DOI] [PubMed] [Google Scholar]
- 14.Harris GA, Galhena AS, Fernandez FM. Anal Chem. 2011;83:4508–4538. doi: 10.1021/ac200918u. [DOI] [PubMed] [Google Scholar]
- 15.Ferreira CR, Yannell KE, Jarmusch AK, Pirro V, Ouyang Z, Cooks RG. Clinical chemistry. 2016;62:99–110. doi: 10.1373/clinchem.2014.237164. [DOI] [PMC free article] [PubMed] [Google Scholar]
- 16.Ma X, Ouyang Z. Trends Anal Chem. 2016;85:10–19. doi: 10.1016/j.trac.2016.04.009. [DOI] [PMC free article] [PubMed] [Google Scholar]
- 17.Chen H, Ouyang Z, Cooks RG. Angewandte Chemie. 2006;45:3656–3660. doi: 10.1002/anie.200600660. [DOI] [PubMed] [Google Scholar]
- 18.Ifa DR, Wu C, Ouyang Z, Cooks RG. Analyst. 2010;135:669–681. doi: 10.1039/b925257f. [DOI] [PubMed] [Google Scholar]
- 19.Black C, Chevallier OP, Elliott CT. Trends Anal Chem. 2016;82:268–278. [Google Scholar]
- 20.Badu-Tawiah AK, Eberlin LS, Ouyang Z, Cooks RG. Annu Rev Phys Chem. 2013;64:481–505. doi: 10.1146/annurev-physchem-040412-110026. [DOI] [PubMed] [Google Scholar]
- 21.Lawton ZE, Traub A, Fatigante WL, Mancias J, O’Leary AE, Hall SE, Wieland JR, Oberacher H, Gizzi MC, Mulligan CC. J Am Soc Mass Spectrom. 2016 doi: 10.1007/s13361-016-1562-2. [DOI] [PubMed] [Google Scholar]
- 22.Liu J, Wang H, Manicke NE, Lin JM, Cooks RG, Ouyang Z. Anal Chem. 2010;82:2463–2471. doi: 10.1021/ac902854g. [DOI] [PubMed] [Google Scholar]
- 23.Wang H, Liu J, Cooks RG, Ouyang Z. Angewandte Chemie. 2010;49:877–880. doi: 10.1002/anie.200906314. [DOI] [PubMed] [Google Scholar]
- 24.Zhang C, Manicke NE. Anal Chem. 2015;87:6212–6219. doi: 10.1021/acs.analchem.5b00884. [DOI] [PubMed] [Google Scholar]
- 25.Manicke NE, Abu-Rabie P, Spooner N, Ouyang Z, Cooks RG. J Am Soc Mass Spectrom. 2011;22:1501–1507. doi: 10.1007/s13361-011-0177-x. [DOI] [PubMed] [Google Scholar]
- 26.Su Y, Wang H, Liu J, Wei P, Cooks RG, Ouyang Z. Analyst. 2013;138:4443–4447. doi: 10.1039/c3an00934c. [DOI] [PMC free article] [PubMed] [Google Scholar]
- 27.Soparawalla S, Tadjimukhamedov FK, Wiley JS, Ouyang Z, Cooks RG. Analyst. 2011;136:4392–4396. doi: 10.1039/c1an15493a. [DOI] [PubMed] [Google Scholar]
- 28.Zhang Z, Cooks RG, Ouyang Z. Analyst. 2012;137:2556–2558. doi: 10.1039/c2an35196j. [DOI] [PubMed] [Google Scholar]
- 29.Li A, Wei P, Hsu HC, Cooks RG. Analyst. 2013;138:4624–4630. doi: 10.1039/c3an00888f. [DOI] [PubMed] [Google Scholar]
- 30.Pereira I, Rodrigues SRM, de Carvalho TC, Carvalho VV, Lobón GS, Bassane JFP, Domingos E, Romão W, Augusti R, Vaz BG. Anal Methods. 2016;8:6023–6029. [Google Scholar]
- 31.Guo T, Fang P, Jiang J, Zhang F, Yong W, Liu J, Dong Y. Journal of chromatography A. 2016;1471:27–33. doi: 10.1016/j.chroma.2016.09.073. [DOI] [PubMed] [Google Scholar]
- 32.Reeber SL, Gadi S, Huang SB, Glish GL. Anal Methods. 2015;7:9808–9816. [Google Scholar]
- 33.Yang B-c, Wang F, Deng W, Zou Y, Liu F-y, Wan X-d, Yang X, Liu H, Huang O-p. Anal Methods. 2015;7:5886–5890. [Google Scholar]
- 34.Shiea C, Huang YL, Liu DL, Chou CC, Chou JH, Chen PY, Shiea J, Huang MZ. Rapid communications in mass spectrometry : RCM. 2015;29:163–170. doi: 10.1002/rcm.7086. [DOI] [PubMed] [Google Scholar]
- 35.Gerbig S, Brunn HE, Spengler B, Schulz S. Anal Bioanal Chem. 2015;407:7379–7389. doi: 10.1007/s00216-015-8900-2. [DOI] [PubMed] [Google Scholar]
- 36.Beneito-Cambra M, Pérez-Ortega P, Molina-Díaz A, García-Reyes JF. Anal Methods. 2015;7:7345–7351. [Google Scholar]
- 37.Ren Y, Chiang S, Zhang W, Wang X, Lin Z, Ouyang Z. Analytical and bioanalytical chemistry. 2016;408:1385–1390. doi: 10.1007/s00216-015-9129-9. [DOI] [PubMed] [Google Scholar]
- 38.Li L, Chen TC, Ren Y, Hendricks PI, Cooks RG, Ouyang Z. Anal Chem. 2014;86:2909–2916. doi: 10.1021/ac403766c. [DOI] [PMC free article] [PubMed] [Google Scholar]
- 39.Banerjee S, Mazumdar S. Int J Anal Chem. 2012;2012 doi: 10.1155/2012/282574. [DOI] [PMC free article] [PubMed] [Google Scholar]
- 40.Shah VP, Midha KK, Findlay JW, Hill HM, Hulse JD, McGilveray IJ, McKay G, Miller KJ, Patnaik RN, Powell ML. Pharm Res. 2000;17:1551–1557. doi: 10.1023/a:1007669411738. [DOI] [PubMed] [Google Scholar]
- 41.Pelajic M, Pecek G, Mutavdzic Pavlovic D, Vitali Cepo D. Food chemistry. 2016;200:98–106. doi: 10.1016/j.foodchem.2016.01.018. [DOI] [PubMed] [Google Scholar]
- 42.Shen Y, Li Z, Ma Q, Wang C, Chen X, Miao Q, Han C. J Agric Food Chem. 2016;64:3901–3907. doi: 10.1021/acs.jafc.6b00530. [DOI] [PubMed] [Google Scholar]
Associated Data
This section collects any data citations, data availability statements, or supplementary materials included in this article.


