
Figure 3. ER–mitochondrial apposition is regulated by C99.
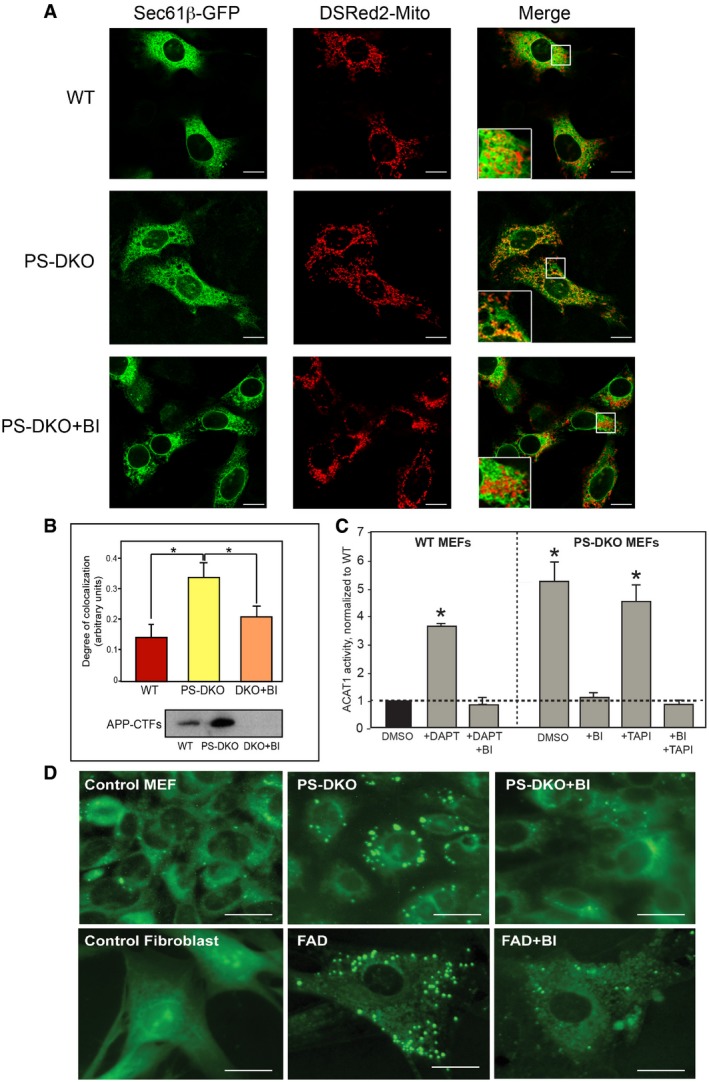
- Localization of ER (green) and mitochondria (red) in the indicated MEFs without and with BACE1 inhibitor (inhibiting C99 formation; see Western in panel B). Large boxes in the Merge are enlargements of the small boxes. Scale bars = 20 μm.
- Quantitation by ImageJ analysis of the colocalization of ER and mitochondrial signals from experiments like the one shown in (A) (average of n = 4 independent experiments ± SD). *P < 0.05. Analysis by unpaired t‐test. The Western blot indicates the APP‐CTF levels in the indicated cells (30 μg of protein per lane).
- ACAT1 activity in WT and PS‐DKO MEFs in the presence and absence of α‐, β‐, and/or γ‐secretase inhibitors (average of n = 4 independent experiments ± SD). *P < 0.05. Analysis by unpaired t‐test. ACAT activity was normalized by controls (WT incubated with vehicle [DMSO]).
- Staining of the indicated cells with LipidTox Green to detect lipid droplets. Scale bars = 20 μm.