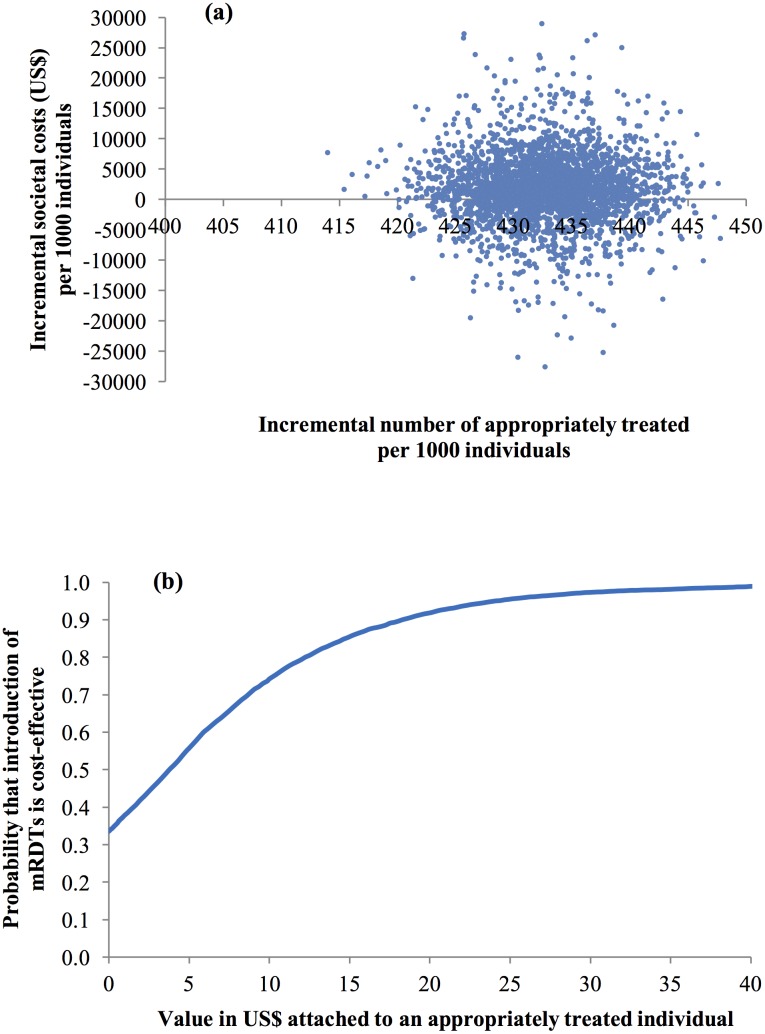
Fig 4. Probabilistic sensitivity analysis (societal perspective).
(a) scatter plot of incremental societal cost in US$ and incremental number of individuals appropriately treated of malaria resulting from replacing clinical diagnosis of malaria by rapid diagnostic test in drug shops, Mukono District, Uganda, 2011 (US$1 = GHS1.51) and (b) cost-effectiveness acceptability curve.

