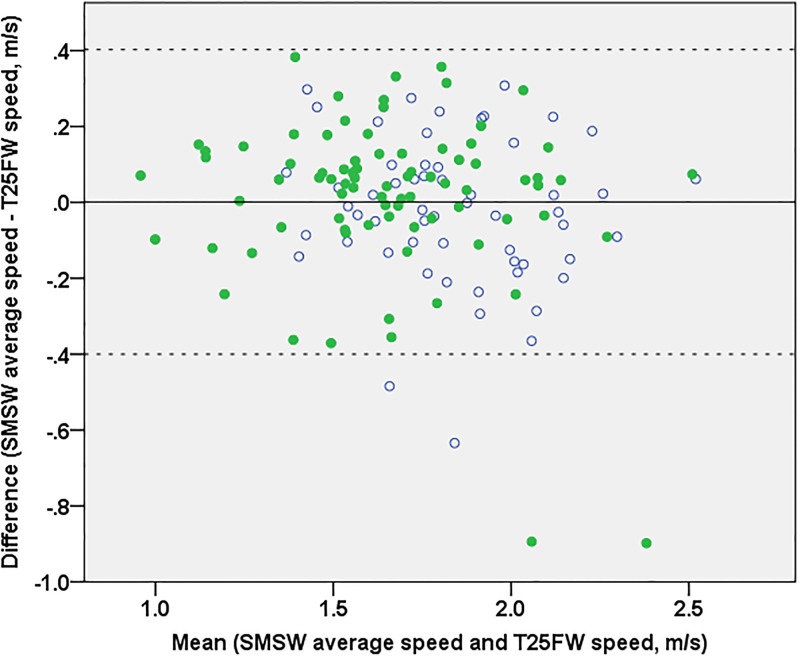
Fig 3. Bland-Altman plot of the differences between SMSW average speed and T25FW speed.
Mean difference (solid line) and limits of confidence (dashed lines) refer to the whole dataset. For better interpretation, HC are rendered as open circles and PwMS as filled circles. In two HC and two PwMS, the difference between both maximum speeds was outside the limits of agreement. All four showed an overestimation of T25FW versus SMSW average speed but did not have any other specific feature in common.

