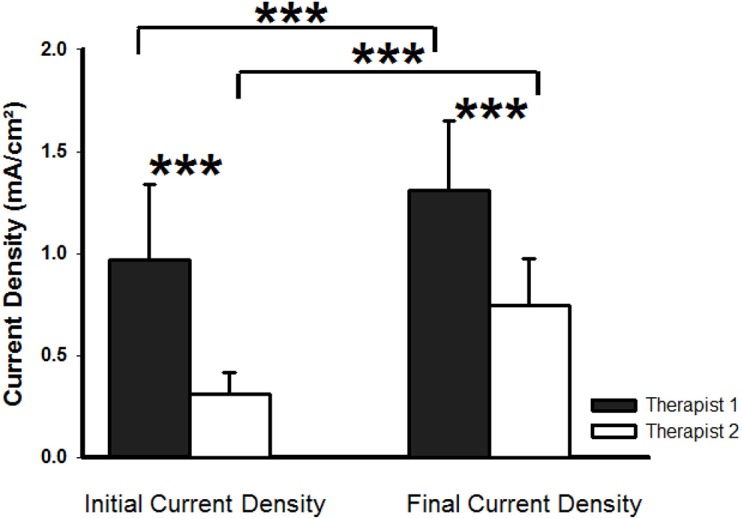
Fig 2. Current density.

Current density (mA/cm2) applied by Therapist 1 (black bars) and by Therapist 2 (white bars) at the onset and the end of the TENS stimulation session. Data are represented as mean and standard deviation of current density. *** p<0.001.
