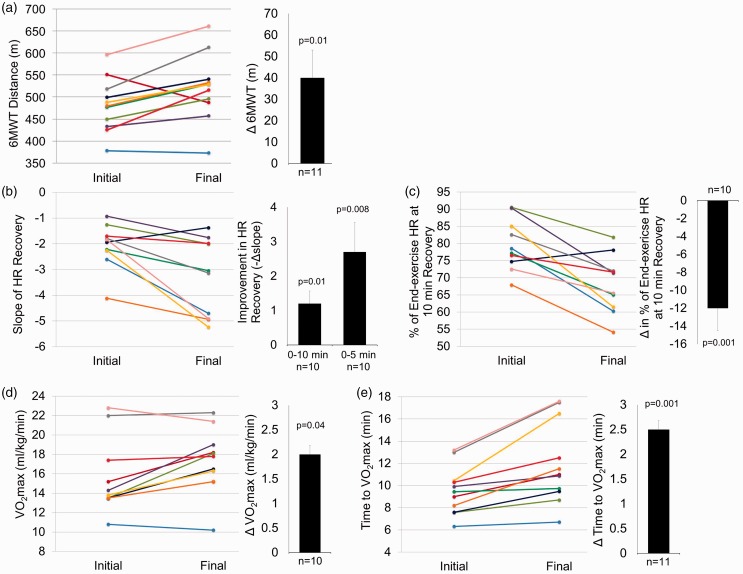
Fig. 3.
Training improvements in aerobic exercise tolerance and cardiorespiratory fitness. Individual responses are presented as different colored lines from initial to final values for 11 patients who completed the study. Paired t-testing was used to analyze changes between the pre-test (Initial) and post-test at the end of 12 weeks (Final) in all outcome variables. Mean ± SEM and P values for pre- to post-intervention change are presented in bar graphs adjacent to individual responses. (a) 6MWT distance for n = 11; (b) HRrecovery as slope of relationship between HR and 0–10 min of recovery following 6MWT for n = 10 (missed collection in one participant), including an additional bar graph indicating mean ± SEM for slope of relationship between HR and 0–5 min of recovery; (c) HRrecovery % of end-6MWT HR at the 10-min recovery time point for n = 10 (missed collection in one individual); (d) maximal rate of oxygen consumption relative to kg of body mass (VO2max) in CPET for n = 10 (unable to collect expired gases in one participant that required supplemental oxygen during exercise); (e) number of minutes completed of CPET incremental treadmill protocol for n = 11.

