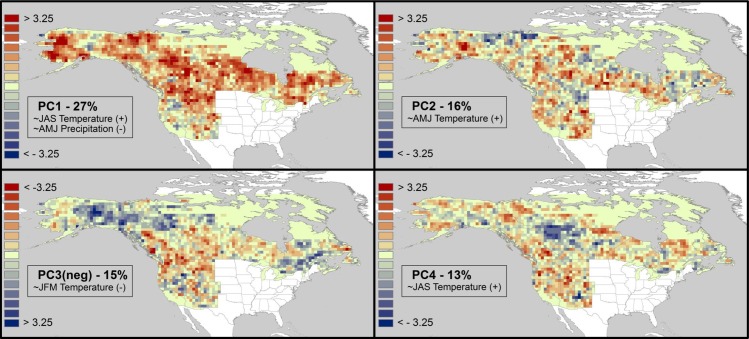
Fig 3. Results of PCA analysis of z coefficients of a complete multiple regression model in each grid cell.
Panels show the first four principal components and percent in variation in AAB explained. Seasonal climate variables correlated with PC loadings at r ≥ 0.5 are listed including the sign of the correlation with AAB. (a) PC1, summer temperature (+) and spring precipitation (-); (b) PC2, spring temperature (+); (c) PC3, winter temperature (-); (d) PC4, preceding year summer temperature (+). Red (blue) colors indicate increases (decreases) in log-transformed AAB with increases in variables correlating positively/negatively with PC scores. Note that PC3 is inverted in sign for ease in interpretation. See S1 Fig for PC5.

