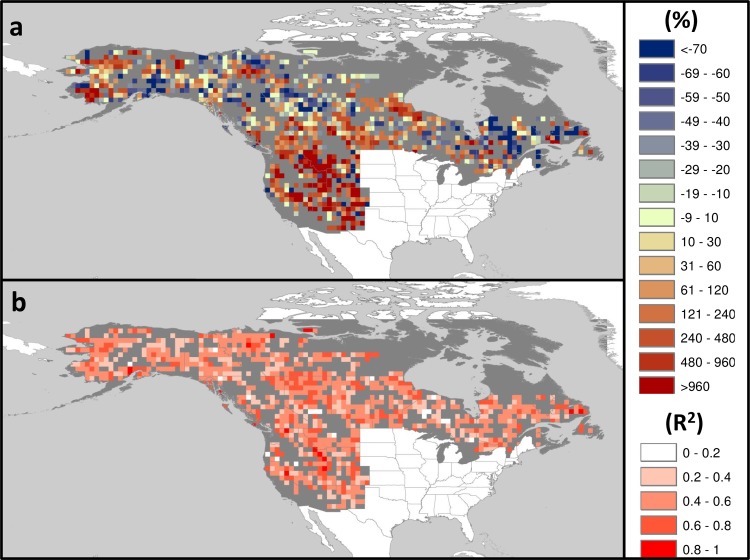
Fig 7. Projected change in AAB.
Projections rates are for the period 2010–2039 compared to the period 1961–2004 based on ensemble of A1B emission scenarios. (a) Percent change in AAB resulting from stepwise selection of individual cell-based models, based on AIC model selection criteria; (b) proportion of variance explained (R2). Only significant models (p < 0.05) are plotted.

