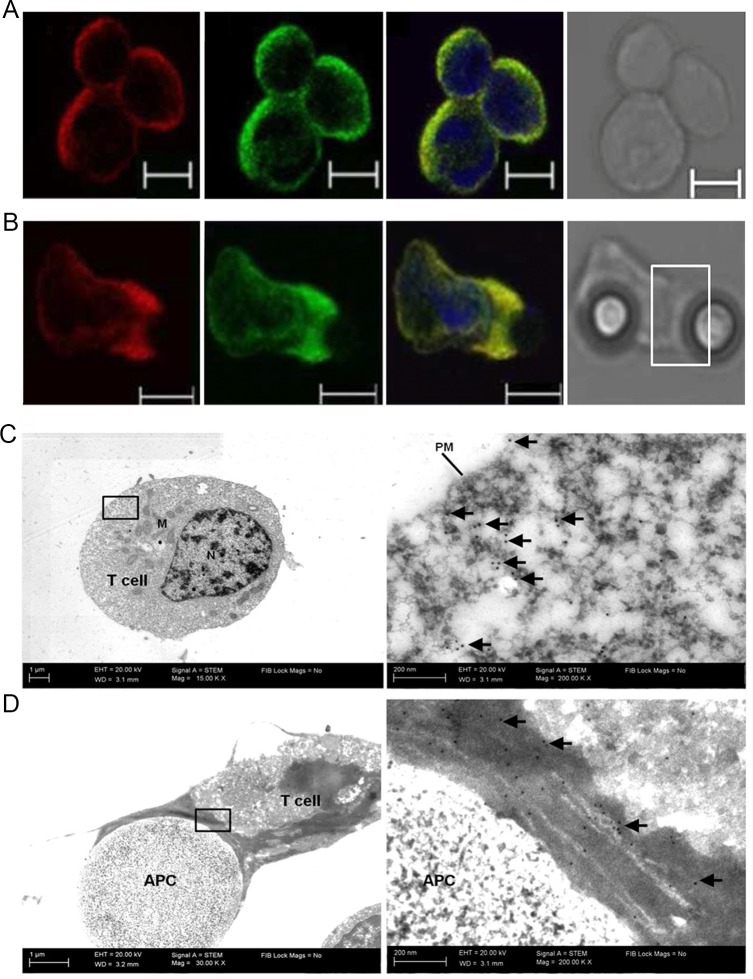
Fig 2. Spectrin translocates together with actin to the IS upon T-cell activation.
(A-B) Distribution of spectrin (red, 1) and actin (green, 2) in primary T lymphocytes from PBMCs population in the absence (naive) (A) or presence (activated) (B) of Dynabeads coated with anti-CD3 and anti-CD28, along with a merged (3) and a TL(4) image. The white rectangle marks the contact site. The scale bar = 5μm. The results are representative of at least three independent experiments. (C-D) Transmission electron micrographs of non-activated (C) and activated with Dynabeads coated with anti-CD3 and anti-CD28 (D) Jurkat T-cells labeled with antibodies directed against spectrin, followed by gold-conjugated secondary antibodies. The right column shows enlarged images of the marked areas. Arrows point to gold particles (spectrin). Almost all of the gold in panel D accumulate at the point of cell-bead contacts. Abbreviations: APC-antigen presenting cell simulated by Dynabeads coated with anti-CD3 and anti-CD28; N-nuclei, PM-plasma membrane, M-mitochondria. Magnification 30 000x, scale bar = 1 μm (200 000x, scale bar = 200 nm), indicated on micrographs.

