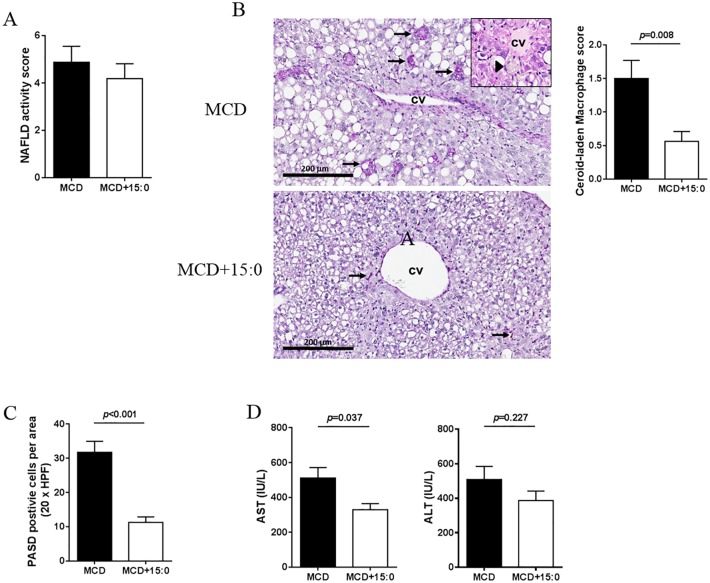
Fig 6. Effects of 15:0-supplemented MCD diet in vivo.
(A) NAS scores from H&E stained slides. (B) Histologic evaluation by H&E and (C) Periodic acid Schiff with diastase (PAS-D) staining in liver from mice treated with MCD or with MCD+15:0. (D) AST and ALT levels in mice treated with MCD or with MCD+15:0.

