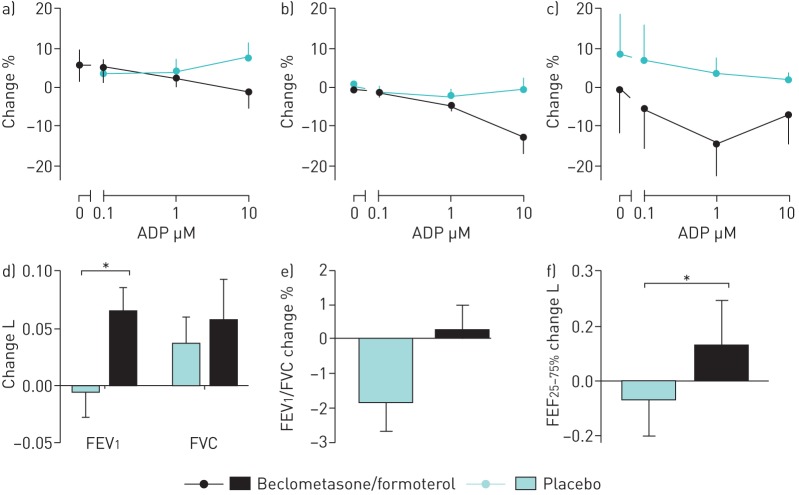
FIGURE 1.
Change from baseline following beclomethasone/formoterol and placebo in a) platelet–monocyte aggregate formation, b) P-selectin expression and c) platelet fibrinogen expression when unstimulated and following stimulation with ADP 0.1–10 µM. Change from baseline in d) forced expiratory volume in 1 s (FEV1) and forced vital capacity (FVC), e) forced expiratory ratio and f) forced expiratory fraction at 25–75% of FVC (FEF25–75%) following treatment with beclomethasone/formoterol versus placebo. Data are presented a mean±sem. *: p<0.05.

