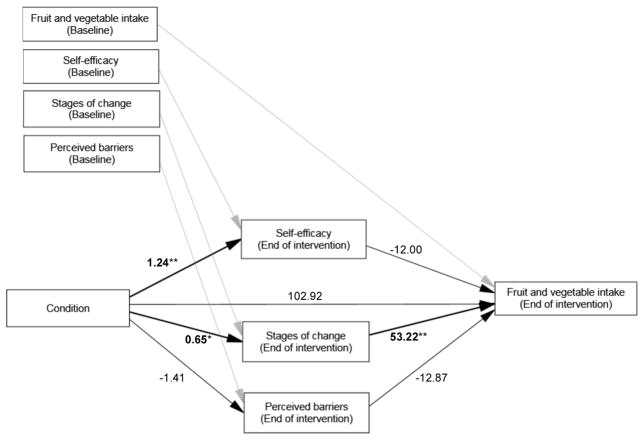
Figure 5.
Basic multiple mediator model of psychosocial outcome measures at end of intervention on F&V intake. Error terms for all outcome measures were included in the analysis but omitted in this figure. Values are β values, p-values <0.05 are denoted with an asterisk (*), and p-values <0.01 are denoted with a double asterisk (**). “Condition” represents discount group versus control group. All variables were controlled by baseline covariates (in upper left boxes) which are connected by grey arrows to the variables. At the end of the intervention, the intervention group had 1.24 higher SE score than the control group (p<0.01), a 0.65 higher SOC score than the control group (p<0.05), and a PB score 1.41 lower than the control group (p=0.057).

