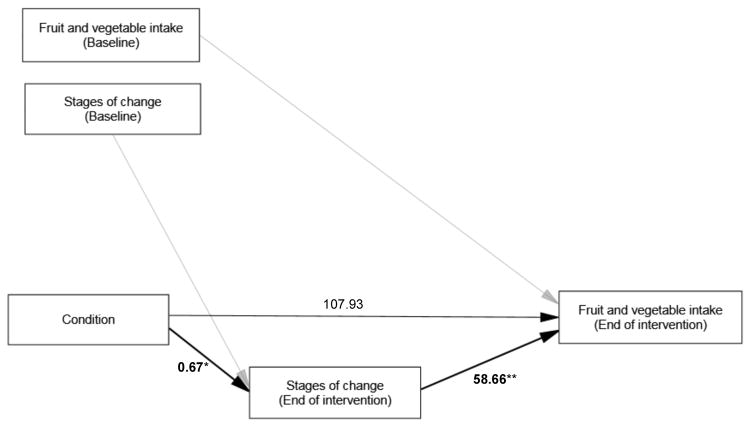
Figure 6.
Final model showing significant mediation effect of stage of change (SOC) at end of intervention on F&V intake. Error terms for all outcome measures were included in the analysis but omitted in this figure. Values are β values, p-values <0.05 are denoted with an asterisk (*), and p-values <0.01 are denoted with a double asterisk (**). “Condition” represents discount group versus control group. All variables were controlled by baseline covariates (in upper left boxes) which are connected by grey arrows to the variables.

