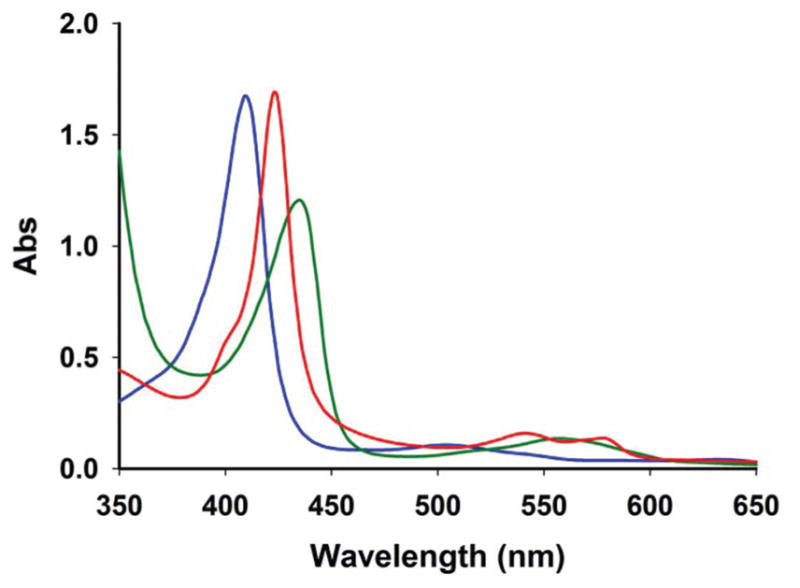
Fig. 8.

UV-Vis traces from the Mb assay for 2 in PBS solution. The blue trace represents oxidized Mb (λmax = 410 nm); bright green trace represents reduced Mb (λmax = 435 nm); red trace represents Mb-CO formation (λmax = 424 nm) upon transfer of CO remotely generated from 2 by visible light illumination (power 15 mW cm−2) for 1 min.
