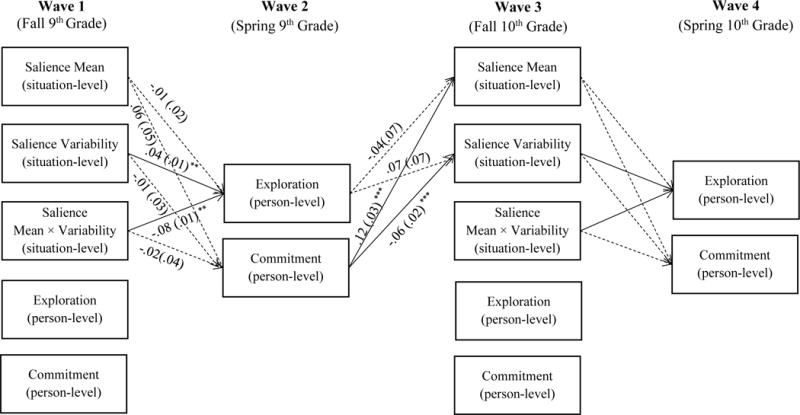
Figure 2.

Significant standardized coefficients and standard errors from path analysis for relations among exploration, commitment, and salience level and variability. Significant coefficients are depicted in solid lines; non-significant coefficients are depicted in dashed lines. Paths from Waves 3 to 4 were constrained to be equal with the same paths from Waves 1 to 2. Stability paths, prior wave controls, and within wave covariances are reported in Table 3. *p < .05. ** p < .01. *** p <.001.
