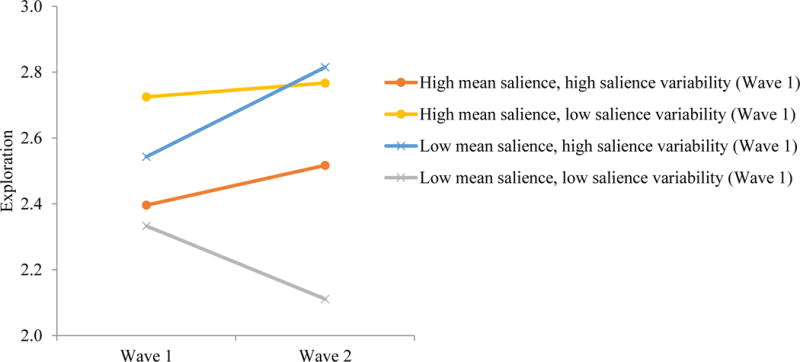
Figure 4.

Descriptives of salience mean, variability, and exploration over time. Data from Waves 1 to 2 were used as an example. High levels of mean salience and variability were assessed at one standard deviation above the mean of each variable, respectively. Low levels of mean salience and variability were assessed at one standard deviation below the mean of each variable, respectively.
