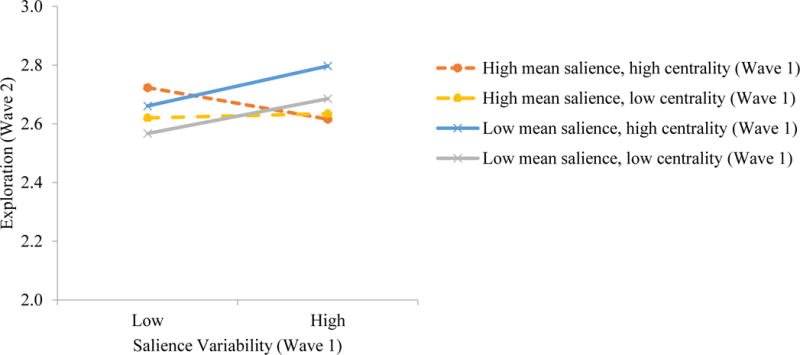
Figure 5.

Interaction effect of centrality, mean salience, and salience variability at Wave 1 for exploration at Wave 2. High centrality was assessed at one standard deviation above the mean, and low centrality was assessed at one standard deviation below the mean. Similarly, high mean salience was assessed at one standard deviation above the mean, and low mean salience was assessed at one standard deviation below the mean. Solid lines indicate significant relations, whereas dashed lines indicate non-significant relations.
