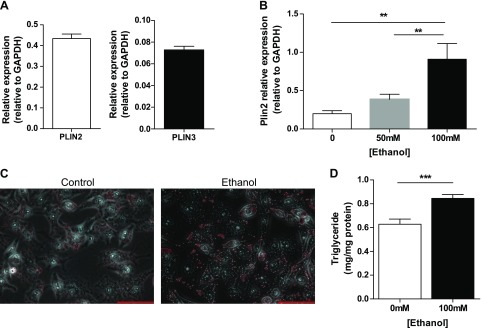
Figure 1.
VL17A cells, an in vitro model of alcoholic steatosis. A) VL17A cells PLIN2 and PLIN3 gene expression at baseline (24 h of plating). B) PLIN2 gene expression in response to 0, 50, or 100 mM Etoh incubation. C) Photomicrograph of Oil-Red-O staining of VL17A cells incubated in Ctrl or Etoh medium (40 times). Scale bars, 100 µm. D) Cellular triglyceride content in response to Ctrl or Etoh medium. **P < 0.01, ***P < 0.0001.

