
Figure 6.
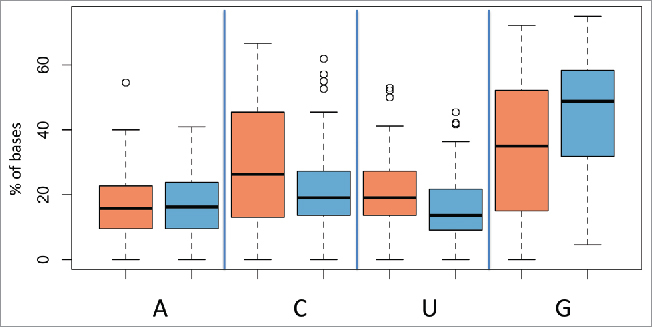
Box-plots showing the percentage of bases for miRNAs that varied significantly between individuals indicated in blue and miRNAs that varied significantly between storage times indicated in red. The nature of the nucleotides is indicated on the X axis with reference to the basis adenine, cytosine, uracil, and guanine and the percentage of the nucleotides on the Y-axis.