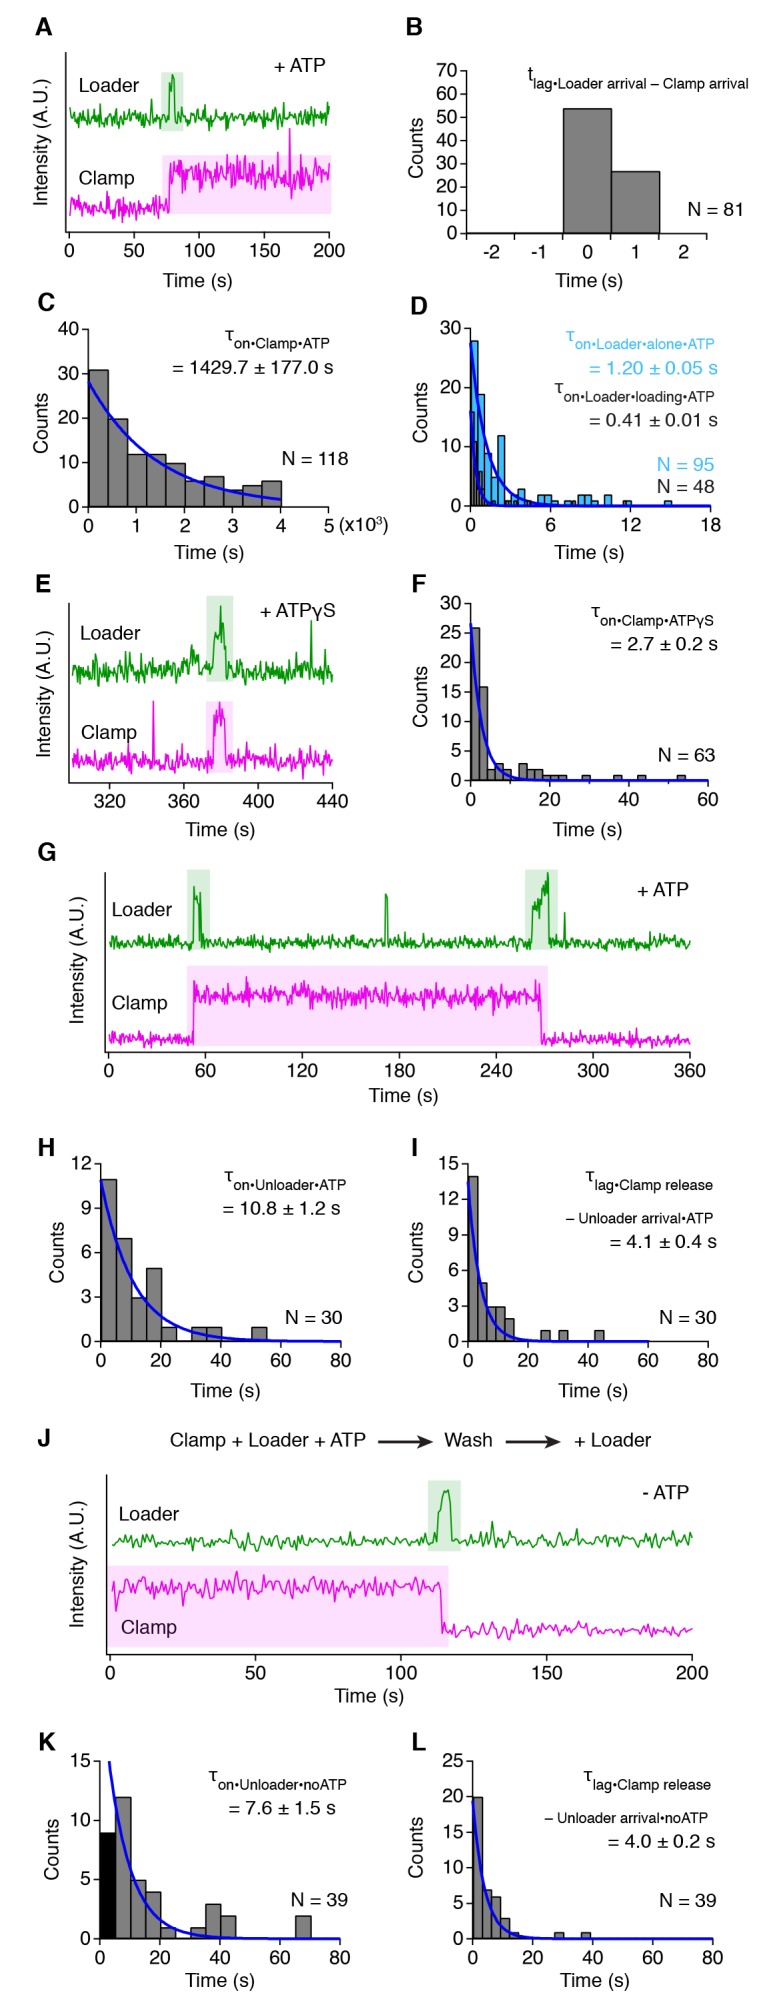
Figure 2. Different mechanisms for clamp loading and unloading.
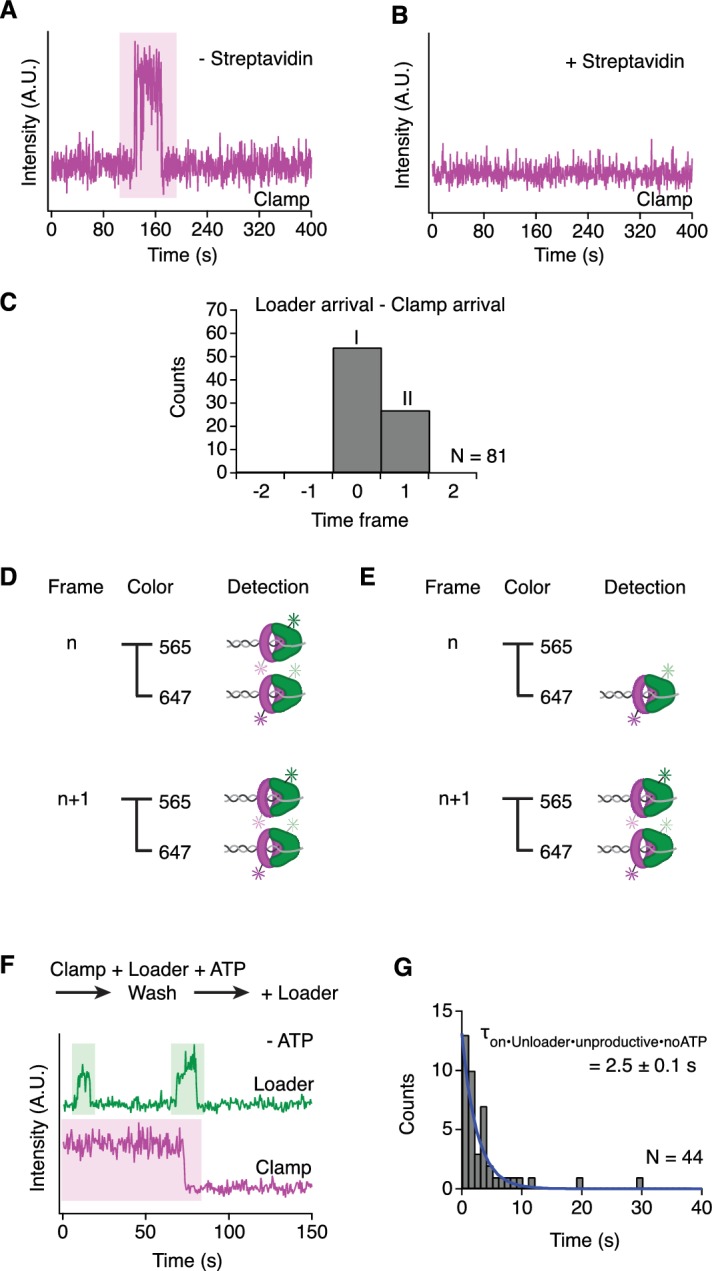
(A) Representative trace showing a clamp loading event on DNA in the presence of ATP. (B) Histogram showing the simultaneous arrival of loader and clamp on DNA (see also Figure 2—figure supplement 1C–E). (C) The distribution of lifetimes for the clamp on DNA after removal of the clamp loader (D) Lifetime of the clamp loader on DNA in the absence (blue bars) and presence (grey bars) of the clamp. (E) Representative trace showing the simultaneous arrival and release of loader and clamp on DNA in the presence of ATPγS. (F) The distribution of lifetimes for the loader and clamp on DNA in the presence of ATPγS. (G) Representative trace showing clamp loading and unloading by the loader in the presence of ATP. (H) The distribution of lifetimes for the loader on DNA during unloading. (I) The distribution of lag times between the arrival of the loader and the release of the clamp. (J) Representative trace showing unloading of a pre-loaded clamp in absence of ATP. (K) The distribution of lifetimes for the loader during clamp unloading in the absence of ATP. The first column (in dark grey) has been excluded from the fitting. The lower numbers in this column are possibly caused by the clamp that needs to be removed first before the loader can release. (L) The distribution of lag times between the arrival of the loader and the release of the clamp in the absence of ATP. All values represent mean lifetime/lag time ±s.e.m.

Figure 2—figure supplement 1. Clamp loading and clamp unloading.

