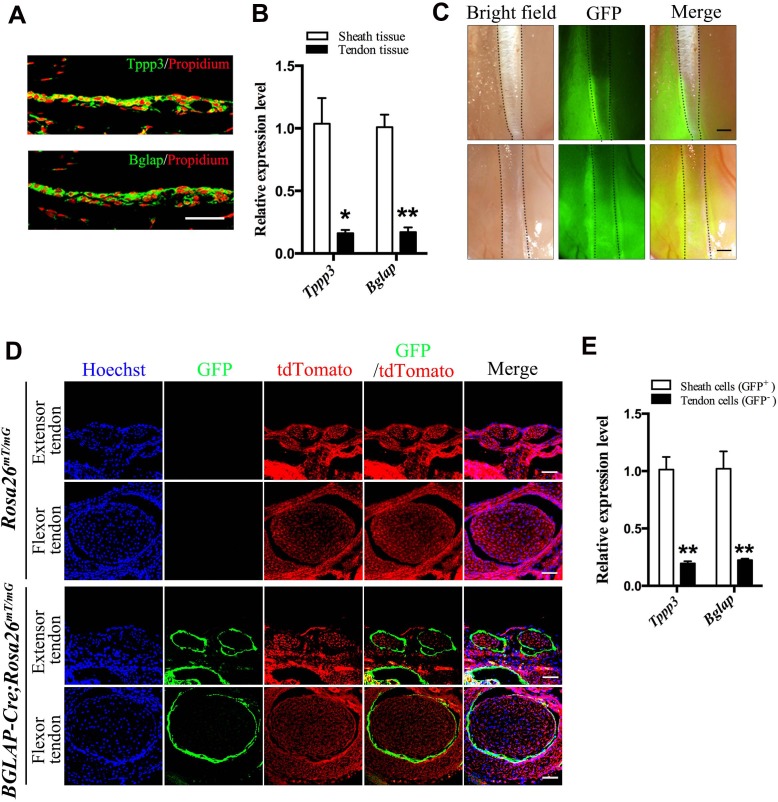
Figure 1. Bglap as a tendon sheath specific marker.
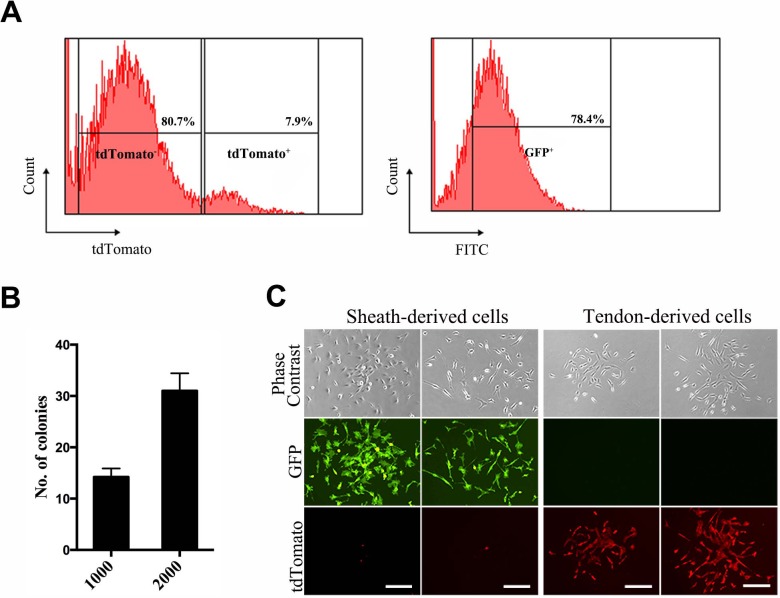
(A) Fluorescent immunohistochemistry of mouse sheath tissues of the adult Tibialis anterior tendon at 2 months old (n = 5 mice per group). Scale bar, 40 μm. (B) QRT-PCR analysis of sheath-specific markers using adult mouse sheath and tendon tissues as shown. Relative expression levels were normalized to β-tubulin and the sheath tissues. Data are means ± s.e.m and were analyzed using Student’s t-tests. *p≤0.013; **p≤0.0014. n = 3 mice per group. (C) Images of peroneus longus and brevis tendon (upper panel) and Tibialis anterior tendon (lower panel) of the BGLAP-Cre;Rosa26mT/mG mice at 2 months old. Dotted lines depict the boundaries of the tendon fibers. GFP signals are observed in the tendon sheath tissues (n = 5 mice per group). Scale bar, 250 μm. (D) Cross-sections of fluorescent microscopic analysis of the extensor tendons and flexor tendons of Rosa26mT/mG and BGLAP-Cre;Rosa26mT/mG mice. Scale bar, 50 μm (n = 5). (E) QRT-PCR analysis of sheath-specific markers using sheath and tendon cells isolated from the BGLAP-Cre;Rosa26mT/mG mice after cell-sorting for green fluorescence (GFP). Relative expression levels were normalized to Gapdh and the sheath cells. Data are means ± s.e.m and were analyzed using a Student’s t-tests. **p≤0.0062. n = 3 biological replicates per group. Additional data for this figure are provided in Figure 1—figure supplement 1.


