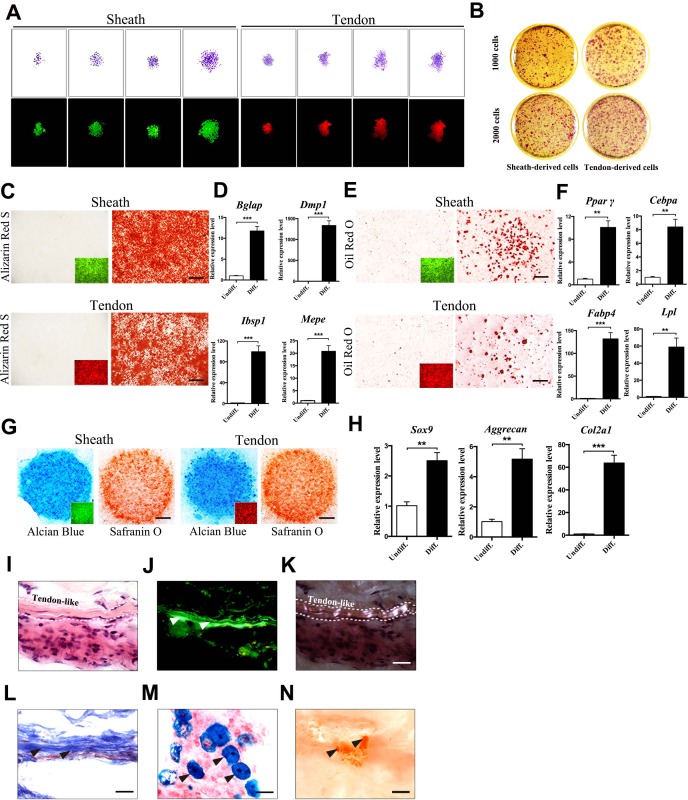
Figure 2. Multipotent differentiation potential of sheath-derived cells.
(A) Colony formation assay using sheath-derived cells (GFP+) or tendon-derived cells (tdTomato+) isolated from the adult tendon tissues of BGLAP-Cre;Rosa26mT/mG mice. Colonies were stained with crystal violet (upper panel) or by fluorescence (lower panel) after 14 days of culture (n = 5). (B) Primary cells were seeded with two different initial cell densities of 1000 or 2000 for 14 days as shown. (C, E, G) Lineage differentiation assay under (C) osteogenic (scale bar, 1000 μm), (E) adipogenic (scale bar, 200 μm), and (G) chondrogenic conditions (scale bar, 1000 μm) using primary cells isolated from the tendon tissues of BGLAP-Cre;Rosa26mT/mG mice after cell-sorting. Insets represent the fluorescence signals of the respective primary cells before differentiation. GFP+ cells represent cells from sheath tissues; tdTomato+ cells represent cells from tendon fibers (n = 3). (D, F, H) QRT-PCR analysis of gene markers for (D) osteogenesis, (F) adipogenesis and (H) chondrogenesis. Relative expression levels were normalized to Gapdh and the undifferentiated condition. Data are means ± s.e.m and were analyzed using Student’s t-tests. **p≤0.0074; ***p≤0.001. n = 3 biological replicates per group. (I–N) Histologic analysis of tendon-like structures using GFP+ sheath cell sheets transplanted into the dorsal surface of immunocompromised mice after 8 weeks. Tendon-like tissues were identified under (I) H&E staining, (J) Green fluorescence, (K) polarized light, and (L) Masson’s trichrome staining. Arrowheads point to regions of (J) tendon-like structure, (M) chondrocytes as shown by Alcian blue staining or (N) mineralized bone as shown by Alizarin Red S staining. Dashed lines indicate the boundaries of tendon-like tissues (n = 5 mice). Scale bar, 20 μm. Additional data for this figure are provided in Figure 2—figure supplement 1.


