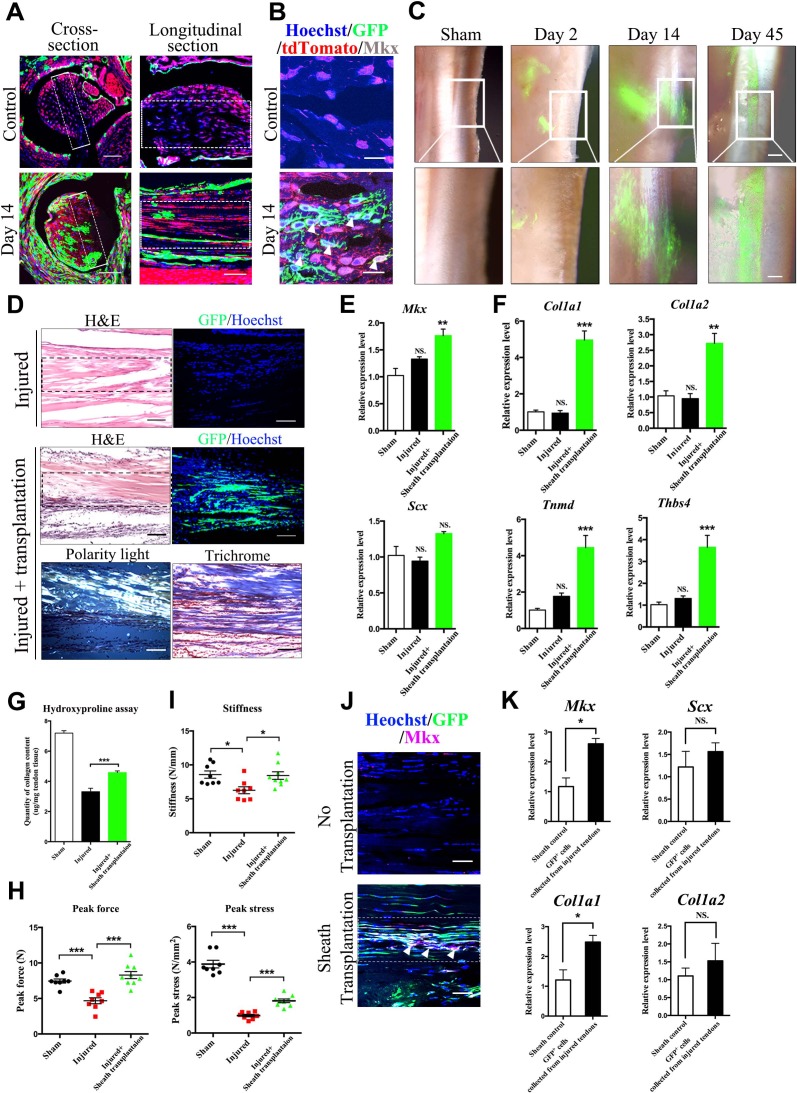
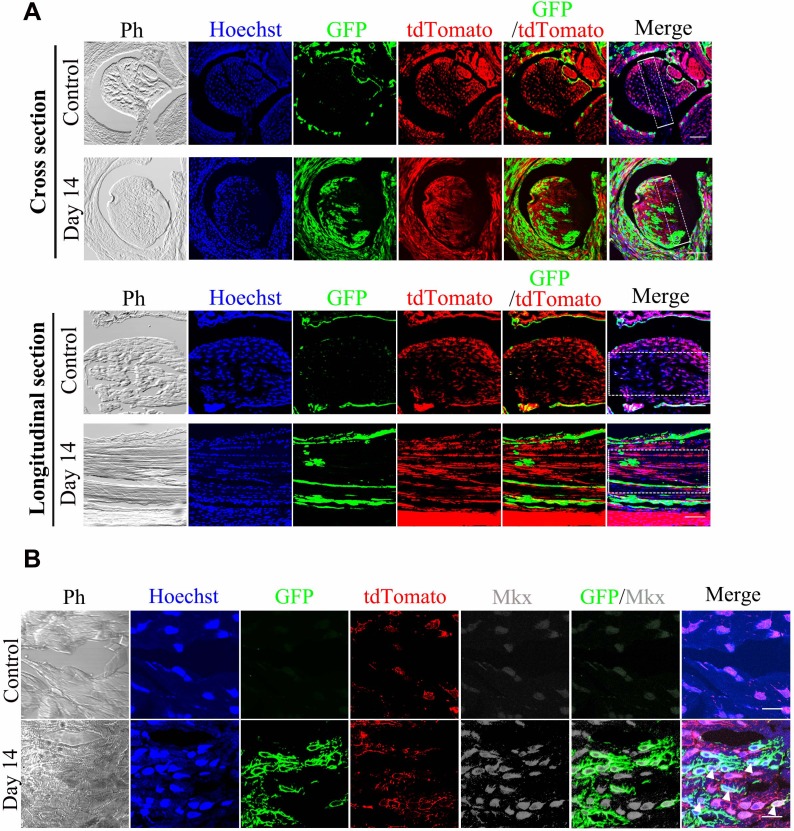
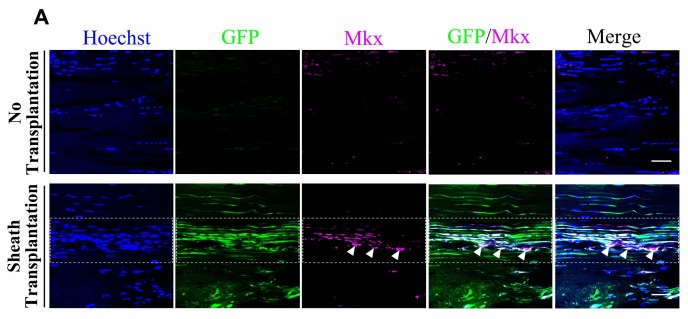
Figure 3. Tendon sheath tissues contribute to tendon repair.
(A) Fluorescence analysis in cross- and longitudinal sections of the Tibialis anterior tendon of BGLAP-Cre;Rosa26mT/mG mice at Day 0 (Control) and Day 14 after injury(without grafting) (n = 3 mice per group). Boxed areas indicate the regions of the injury sites (dashed line). Scale bar, 100 μm. (B) Fluorescence analysis of Mkx in the BGLAP-Cre;Rosa26mT/mG mice Tibialis anterior tendon tissues at Day 0 (Control) and Day 14 after injury (n = 3 mice per group). White arrowheads point to GFP+/Mkx+ cells at the injured site of the BGLAP-Cre;Rosa26mT/mG mouse tendon tissues. Scale bar, 20 μm. (C) GFP+ Tibialis anterior tendon sheath tissues isolated from the BGLAP-Cre;Rosa26mT/mG mice formed tendon-like fibers at the injured Achilles tendon of immunocompromised mice after transplantation. Scale bar, 250 μm. Boxed regions of higher magnification are shown in the lower panel. Scale bar, 100 μm (n = 5 mice per group). (D) Histologic analysis of consecutive sections at the injured sites of the sheath transplantation group (bottom) and the no transplantation group (top) at Day 14 after injury (n = 5 mice). Boxed areas indicate the regions of the injury sites (dashed line). (E, F) Gene expression profiles of (E) tendon progenitor markers and (F) tendon extracellular matrix (ECM) components of the injured tendon at Day 14. Relative expression levels were normalized to Gapdh and the sham group. Data are means ± s.e.m and were analyzed using one-way analysis of variance (ANOVA) followed by Tukey’s multiple comparison test. **p≤0.0021; ***p≤0.0008; NS, not significant. n = 4 mice per group. (G) Hydroxyproline assay of Achilles tendon tissues 4 weeks after injury. Data are means ± s.e.m and were analyzed using one-way analysis of variance (ANOVA) followed by Tukey’s multiple comparison test. ***p≤0.0007. n = 5 mice per group. (H, I) Parameters of mechanical testing of tendon tissues in the sham, tendon-injured and tendon=injured with BGLAP-Cre;Rosa26mT/mG sheath transplantation groups at 4 weeks after surgery. Sheath transplantation represents GFP+ sheath-derived cells sorted from the BGLAP-Cre;Rosa26mT/mG mice. Data are means ± s.e.m and were analyzed using one-way analysis of variance (ANOVA) followed by Tukey’s multiple comparison test. ***p≤0.001, *p≤0.0228. n ≥ 8 mice per group. (J) Co-localization of Mkx and BGLAP-Cre/GFP at the injured sites of the nude mice tendon tissues with or without the sheath transplantation at Day 14 after injury (n = 5 mice per group). White arrowheads point to GFP+/Mkx+ cells at the injured site of the nude mice tendon tissues with BGLAP-Cre;Rosa26mT/mG sheath transplantation. Boxed areas indicate the regions of the injury sites (dashed line). Scale bar, 20 μm. (K) Gene-expression profiles of tendon progenitor markers and ECM components of FACS-sorted GFP+ cells from the nude mice injured tendons with BGLAP-Cre;Rosa26mT/mG sheath transplantation at Day 14. Sheath controls were the FACS-sorted GFP+ cells directly from BGLAP-Cre;Rosa26mT/mG sheath tissues. Relative expression levels were normalized to β-tubulin and the sheath control group. Data are means ± s.e.m and were analyzed using Student’s t-tests. *p≤0.0383; NS, not significant. n = 3 replicates per group.


