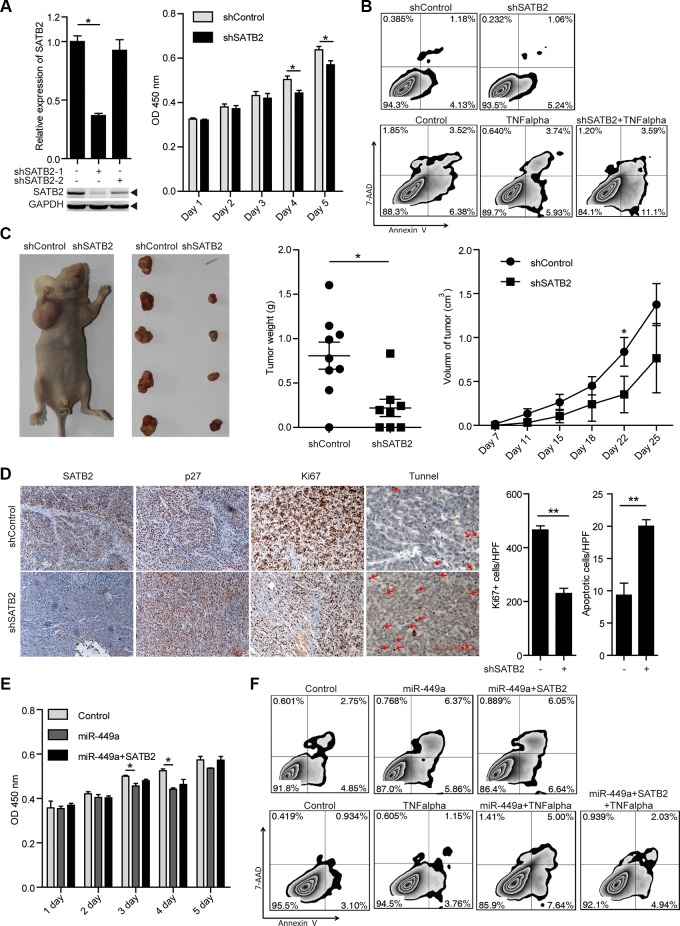
Figure 4. SATB2 knockdown inhibits CRC cell growth in vitro and in vivo.
(A) SATB2 mRNA (upper panels on the left) and protein (lower panels on the left) levels in HCT116 cells stably expressing the negative control, shSATB2-1 or shSATB2-2 (2 separate sequences to knockdown SATB2). MTT results of HCT116 cells stably expressing shSATB2 or the negative control on the indicated days (right). (B) Annexin V/7-AAD flow cytometry results of HCT116 cells stably expressing shSATB2 or the negative control with or without TNF alpha (10 ng/ml). (C) Tumor growth in mice injected with HCT116 cells stably expressing shSATB2 or the negative control (left 2 panels). Tumor weight (middle) and volume (right) in mice injected with HCT116 cells stably expressing shSATB2 or the negative control (n = 9). (D) Immunohistochemistry results of SATB2, p27, and Ki67. TUNEL assays in tumors derived from HCT116 cells stably expressing shSATB2 or the negative control. (E )MTT results of HCT116 cells stably expressing miR-449a or the negative control with or without SATB2-CDS overexpression on the indicated days. (F) Annexin V/7-AAD flow cytometry results of HCT116 cells stably expressing miR-449a or negative control with or without SATB2-CDS overexpression and TNF alpha (10 ng/ml).

