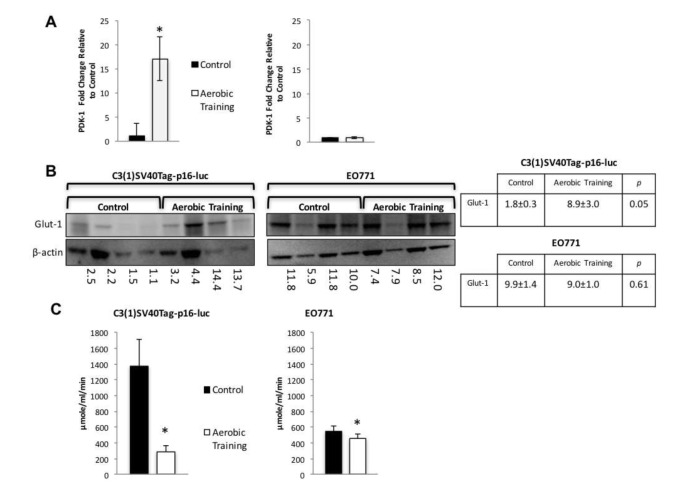
Figure 4. Aerobic training effects on PDK-1 gene expression, Glut-1 protein expression, and citrate synthase activity in mouse breast tumors.
A. PDK-1 gene expression in mouse tumors. PDK-1 gene expression shown as fold change relative to control. (Left) C3(1)SV40Tag-p16-luc on left; (Right) EO771. (n = 6/group). Values are mean ± S.E.M.; *p < 0.05. B. Glut-1western blot. C3(1)SV40Tag-p16-luc tumors (Left), EO771 tumors (Right); C3(1)SV40Tag-p16-luc mouse tumors: Mean densitometry normalized to β-actin : Aerobic Training, 8.92; Control, 1.84; (p = 0.05); EO771 mouse tumors: Mean densitometry normalized to β-actin : Aerobic Training, 8.97; Control, 9.91; (p = 0.61). C. Citrate synthase activity in mouse tumors. (Left) C3(1)SV40Tag-p16-luc control and aerobic training tumors, (Right) EO771 control and aerobic training tumors. Values are mean ± S.E.M. (n = 6/group); *p < 0.05.

