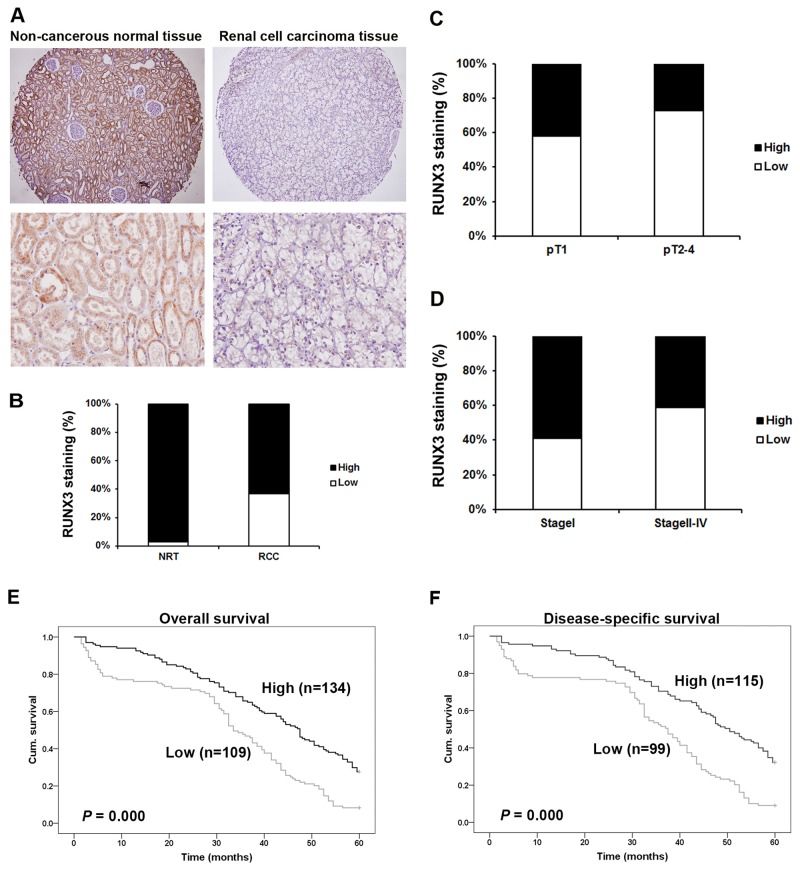
Figure 1. Correlation between RUNX3 expression and RCC clinicopathologic parameters.
Representative IHC photographs taken at different magnifications in RCC and adjacent normal renal tissues showed RUNX3 staining in TMA (Top ×100, bottom ×400) A. RUNX3 expression in RCC tissues was lower than in adjacent normal renal tissues (P<0.001, χ2 test) B. Low RUNX3 expression was correlated with depth of invasion (P<0.001, χ2 test, comparing pT1 versus pT2–pT4) C. and TNM stage (P<0.001, c2 test, comparing I versus II-IV) D. Kaplan–Meier curves of 5-year OS (P<0.001, log rank test) E. and DSS (P <0.001, log rank test) F. according to RUNX3 expression in 243 RCC patients.

