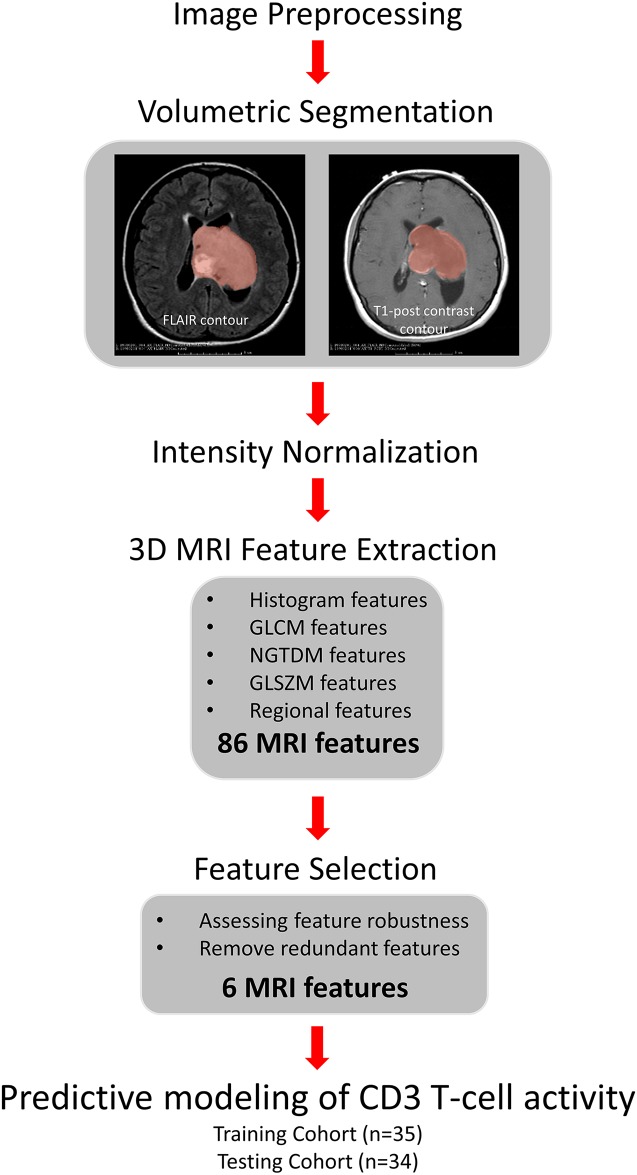
Figure 2. The pipeline for feature extraction and predictive modeling.
We contoured tumor regions from pre-processed T1-post and T2-FLAIR images and performed intensity normalization. 86 MRI image features were derived from TCGA data set and reduced to 6 by robustness analysis and redundant feature removal. Using these 6 features, we constructed a predictive model for CD3 activity using the training set, and evaluated on the testing set.

