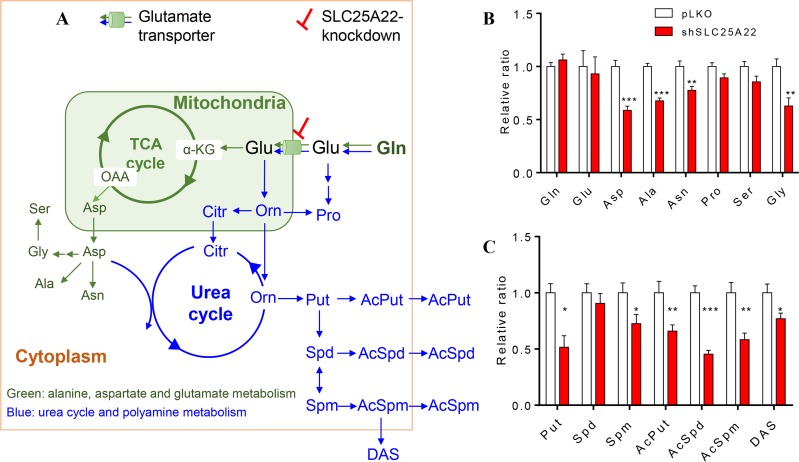
Figure 3. Targeted metabolomics metabolites between pLKO and shSLC25A22 cells.
(A) Scheme overview of glutamine metabolism in mitochondria and cytoplasm. The green arrows and metabolites represented the alanine, aspartate and glutamate metabolism, the blue arrows and metabolites represented the urea cycle and polyamine metabolism. (B) Relative ratio of amino acids in alanine, glutamate and aspartate pathway between pLKO and shSLC25A22 cells, (C) Relative ratio of polyamines between pLKO and shSLC25A22 cells. *p < 0.05, **p < 0.01, and ***p < 0.001. Error bar represented the SEM. Gln: glutamine, Glu, glutamate, α-KG: α-ketoglutarate, OAA: oxaloacetate, Asp: aspartate, Asn: asparagine, Ala: alanine, Pro: proline, Ser: serine, Gly: glycine, Orn: Ornithine, Citr: citrulline, Put: putrescine, Spd: spermidine, Spm: spermine, AcPut: N1-Acetylputrescine, AcSpd: N1-Acetylspermidine, AcSpm: N1-Acetylspermine, DAS: N1, N12-Diacetylspermine.

